

[Updated 12/12/07: Added myth #21, since ice cores show CO2 increasing after temperature increases in the past, it must be occuring this time too.]
[Updated 9/15/07: Added myths #19 & #20, climate predictions aren’t possible and volcanoes emit more CO2 than people, respectively]
The Earth is heating up, and human beings burning fossil fuels are the dominant cause. It’s not ocean warming that dominates, it’s not cosmic rays, it’s not variations in the Earth’s orbit and tilt toward the sun (Milankovitch cycles), it’s not solar irradiance – it’s us. But there is a very vocal minority that refuses to accept that global heating is real.
Global heating deniers fall back on a variety of myths in order to buttress their position. These myths vary from logical fallacies to pseudoscience to poor math to scientifically valid but disproved hypotheses. Yet every single claim against global heating I’ve found has been debunked at one time or another, and at this point, the only hypothesis that fits all the available data is that human civilization is heating up the planet.
I’ve gathered the top anti-global heating myths into the following list and provided a reasonably thorough debunking for every one. I’ve focused only on the scientific claims because they can be addressed with data, and I’ll be adding more as they come up and as time allows. There were a number of claims that tied together, so I addressed them all at once rather than independently. In addition, I’ve attempted to quote the original references instead of th e IPCC Working Group I: The Physical Basis for Climate Change detailed report (not the summary for policymakers) – too many people reject the IPCC out of hand and it’s always better to use the original source if it’s available.
- Table of Contents
- Myth #1: All the CO2 in the air at present comes from the mantle.
- Myth #2: Increasing CO2 in the air is due to gases coming out of solution as the ocean heats up.
- Myth #3: Humans are not the source of the recent increase in atmospheric CO2 concentration.
- Myth #4: CO2 is rising at 0.38% per year, not 1% per year as the IPCC Third Assessment Report claimed.
- Myth #5: CO2 is such a weak greenhouse gas that it cannot be the cause of the observed warming.
- Myth #6: CO2 concentrations are not correlated with global temperature due to periods in the geologic history when CO2 was higher and the planet was in an ice age.
- Myth #7: Temperatures during the Medieval Warm Period were warmer than modern temperatures.
- Myth #8: The existence of the Medieval Warm Period has been ignored in order to support anthropogenic global heating.
- Myth #9: Modern temperature increases are a direct result of the Earth’s climate exiting the Little Ice Age.
- Myth #10: Global cooling between 1940 and 1970 happened even though anthropogenic CO2 was rising
- Myth #11: Cosmic rays hitting the earth are behind global heating.
- Myth #12: The Stefan-Boltzman law breaks the equations of global heating.
- Myth #13: Computer models are too inaccurate to accurately predict a system as complex as the Earth’s climate.
- Myth #14: The oceanic storage of heat is required to account for the differences between data and early models. But the updated models still require an unrealistically large oceanic depth of water to make them work right.
- Myth #15: The oceans have already begun to cool in response to natural variations, so global heating is wrong.
- Myth #16: Satellite measurements of tropical air don’t correspond to directly measured temperatures, so global heating isn’t actually happening.
- Myth #17: Global heating will be good for the planet, not bad.
- Myth #18: Water vapor is a more powerful greenhouse gas than CO2, and since humans have almost no direct impact on the amount of water vapor in the air, humans can’t be the cause of global heating.
- Myth #19: We don’t have enough climate data to make valid predictions of any kind.
- Myth #20: Volcanoes spew more CO2 into the air in a single eruption than humanity has emitted in its history.
- Myth #21: Ice core data shows that CO2 has always followed an increase in temperature, so this is what must be happening now too.
DENIAL MYTH #1: The source of all the CO2 in the air is outgassing from the mantle (Source: George V. Chilingar’s (of the Department of Civil and Environmental Engineering, University of Southern California) paper titled On global forces of nature driving the Earth’s climate. Are humans involved?).
Debunking: This theory proposes that the bulk of the CO2 in the air and oceans today is a direct result of outgassing from the Earth’s mantle, not from human consumption of fossil fuels. The key piece is this:
Recalculating this amount into the total anthropogenic carbon dioxide emission in grams of CO2, one obtains the estimate 1.003×10¹⁸ g, which constitutes less than 0.00022% of the total CO2 amount naturally degassed from the mantle during geologic history. Comparing these figures, one can conclude that anthropogenic carbon dioxide emission is negligible (indistinguishable) in any energy-matter transformation processes changing the Earth’s climate. (emphasis mine)
In essence, Prof. Chilingar is claiming that anthropogenic (human sourced) CO2 has had a negligible impact on the atmosphere over the last hundred years or so and will have no impact over next few hundred years because we are adding a fraction of the total CO2 outgassed by the mantle over the course of the last 4.5 billion years. Unfortunately, as W. Aeschbach-Hertig, of the Institute of Environmental Physics, University of Heidelberg, says in his rebuttal, there is at least one major error, like the fact that the modern atmosphere had only about 3×10¹⁸ g of CO2 in it (not the full amount every outgassed by the mantle, which is 100,000x greater), so adding 1×10¹⁸ g of new CO2 is a massive percentage change (~33%). In addition, time scales matter here – increasing the amount of CO2 by 33% over the course of a few decades would overwhelm any system (like the Earth’s climate) that has a time constant of centuries. Finally, Prof. Chilingar appeared to attack global heating by concluding that direct heating of the air by human activity (aircraft air friction, power plant thermal plumes, etc.) couldn’t possibly cause the observed heating – which every serious climate scientist (Prof. Chilingar is a petroleum scientist) would agree with completely. Climate scientists say that the greenhouse effect is the cause of global heating, not direct heating by human activity. (source above)
DENIAL MYTH #2: The source of the CO2 in the air is thermal heating of the ocean causing dissolved gases like CO2 to come out of solution and enter the atmosphere (Source: “Apocalypse Canceled”, by Christopher Monckton as well as others).
Debunking: The main idea here is that, if you overlay CO2 concentration data from ice cores with temperature data, you notice that CO2 has always lagged after temperature. Because hot water cannot store as much dissolved gas as cold water can (this is fundamental physics), the data could lead people to reasonably conclude that the ocean is the source of the CO2 in the air and always has been. Unfortunately, there are three problems with this argument. The first is the aforementioned “predictive appeal to history” logical fallacy – just because CO2 has lagged after temperature in the past doesn’t mean it always will (or is this time – it isn’t). The second is that this theory has been tested and been found incorrect.
If heating oceans were the source of the CO2 in today’s atmosphere, we could expect a historical trend of dropping CO2 concentrations in the oceans, yet we see the exact opposite – CO2 concentrations in the ocean have increased even as their temperature has risen, driving down ocean pH (making it more acidic) and will continue to do so (source: Impacts of Anthropogenic CO2 on Ocean Chemistry and Biology, NOAA). In addition, if a hotter ocean were the source of CO2, oxygen would be coming out of solution as well, yet the concentration of oxygen in the atmosphere is actually decreasing, not increasing (sources: Environmental Chemistry.com’s CO2 Pollution and Global Warming page and IPCC Working Group 1 Report, Chapter 2, pages 138-139).
DENIAL MYTH #3: We don’t know for sure where the added CO2 in the atmosphere is coming from, but it’s not from human consumption of fossil fuels (Source: distillation of multiple people’s claims at Wikipedia.org).
Debunking: We know exactly where the added CO2 is coming from, and it most certainly is from human activity (mostly the burning of fossil fuels, but some is from industry and slash-and-burn deforestation for agriculture). Carbon has two stable isotopes (atomic weights), C12 and C13. Plants prefer to use C12 over C13 (it takes slightly less energy to bond to C12 than to C13), so the naturally occurring ratio of the two isotopes is skewed toward C12 in plants. All fossil fuels were originally plants, and so if the C12/C13 ratio in the atmosphere is changing toward increased concentrations of C12, then the source of the new CO2 must be plants. In addition, since animal respiration isn’t enough to skew the C12/C13 ratio and simultaneously affect the concentration of CO2 and oxygen in the atmosphere, the source must be fossil fuels. (sources: Environmental Chemistry.com’s CO2 Pollution and Global Warming page and IPCC Working Group 1 Report, Chapter 2, pages 138-139)
DENIAL MYTH #4: CO2 rates are rising only 0.38% per year, not the 1% per year called out in the Third IPCC assessment report (TAR) (Source: “Apocalypse Canceled”, by Christopher Monckton as well as others).
Debunking: Basically, this claim was used by Mr. Monckton to attack the validity of the TAR’s assessment.  I was unable to find the exact data that Mr. Monckton used, so I’ll use the fourth assessment’s (AR4) data to make a point about how this error could have been made by Mr. Monckton. The average rate of change of the atmospheric concentration of CO2 over the last 250 years has been about 0.14% per year (100 ppm change, ~280 ppm starting point, and the change occurred over 250 years), but rate of change has not been constant. In fact, the average rate of change since ~1960 has been about 0.50% per year,
  and the average rate of change since 1995 has been about 0.68% per year. And if you look at the middle left graph in Figure 3.2 of the IPCC Working Group 1 TAR Chapter 3, on page 201 (shown above), you’ll see that the actual graph of the data looks almost identical to the equivalent IPCC AR4 graph (Figure 1, FAQ2.1, page 135, shown at the left) and the description above. In the case of Mr. Monckton’s data, I suspect that he assumed a linear progression where the rate of change has been accelerating rather than remaining constant. (Source: IPCC Working Group 1 Report, Chapter 2, , page 137)
DENIAL MYTH #5:  CO2 is a sufficiently weak greenhouse gas that it could not be responsible for the level of climate change being modeled and observed (Source: distillation of multiple people’s claims at Wikipedia.org).
Debunking: CO2 is a relatively weak greenhouse gas compared to methane or nitrous oxide. If we use the radiative forcing (RF) values from Table 2.1 (page 141) of the IPCC Working Group 1 Report, Chapter 2 and assume a linear relationship between RF and concentration in the atmosphere, CO2 is about 0.0044 Watts per square meter per ppm (Wm-2ppm-1), compared to 0.2706 Wm-2ppm-1 for methane and 0.5016 Wm-2ppm-1 for nitrous oxide. This means that methane is about 62x as powerful a greenhouse gas than carbon dioxide, and nitrous oxide is about 114x as powerful as CO2. The problem is that CO2 concentration in the atmosphere is measured at 379 ppm, while methane is only 1.774 ppm (1,774 ppb), and nitrous oxide is only .319 ppm (319 ppb). Because there is 213x more CO2 than methane, and 1188x more CO2 than nitrous oxide, the fact that CO2 is a relatively weak greenhouse gas is more than compensated for by concentration in the atmosphere. See also myth #18 below for a discussion of water vapor and CO2.
DENIAL MYTH #6: 450 million years ago was the coldest in 0.5 billion years and also had the highest CO2 concentrations. Because of this, CO2 is not actually correlated global temperature (Source: distillation of multiple people’s claims at Wikipedia.org).
Debunking: Scientists aren’t sure what happened in the late Ordovecian period, when the world plunged into an ice age while CO2 levels were still very high (8-20x current levels). There are some ideas about what happened, however. A 1995 paper titled Reconciling Late Ordovician (440 Ma) glaciation with very high (14X) CO2 levels suggests that the physical location of the megacontinent Gondwanaland may have had something to do with it, and later papers suggest that the problem could be one of resolution of the data – if we can’t tell what the CO2 levels were at the moment of glaciation, then we can’t say whether CO2 being removed from the atmosphere was the cause or not. And if the high CO2 levels plunged due to geologic processes (namely the rise of the Appalachian Mountains and a subsequent carbon sequestration due to the weathering of the mountains), then there would be a mechanism to explain how the CO2 was high while the temperature was also high – the data isn’t detailed enough to know better, so it was actually a lot lower than 8x-20x present day when Gondwanaland froze up. In fact, this identical process is proposed as the cause for the most recent spate of ice ages, with the Himalaya Mountains being the cause. However, ultimately we just don’t know enough about this particular instance to say for sure.
 However, the correlation of CO2 and global temperature is well established over the last 650,000 years using ice core data. The image (click for a larger version) is a composite created by the IPCC from multiple different sources for the WG1 AR4 chapter 6 on Paleoclimate, Figure 6.3, page 444. The black line shows a proxy for local temperature (deuterium), the green line is nitrous oxide, the red line is CO2, the blue line is methane, and the gray line is a proxy for land ice (low=more glaciers/larger ice caps). Notice that not only is CO2 concentration correlated with temperature, but so is methane concentration.
But the most interesting part of this graph is the three stars in the upper right corner of the image. They are to scale with the associated lines and represent the 2000 concentrations of nitrous oxide (green star), CO2 (red star), and methane (blue star).
DENIAL MYTH #7: The Medieval Warm Period/Medieval Climate Anomaly (MWP) was warmer than conditions today (Source: “Apocalypse Canceled”, by Christopher Monckton among others).
Debunking: This claim has been addressed repeatedly, and every example I found basically summarized down to this: The evidence used by most scientists that believe this claim is anecdotal at best and that while this evidence applies regionally to the area between Greenland and the Ural Mountains, there is not yet enough evidence to support this claim on a hemispherical basis, never mind a global basis. In addition, there is a chance that the MWP and the Little Ice Age (see myth #9 below) are both artificial and arbitrary and are actually representative a gradual cooling trend as opposed to a periodic oscillation in the global temperature. Check through all the sources for more detailed information. (Sources: Climate of the Last Millennium, by Raymond S. Bradley, Climate System Research Center, Dept. of Geosciences, University of Massachusetts, Amherst, IPCC Working Group 1 Report, Chapter 6, Figure 6.10 and Box 6.4, pages 467-469, Climate Over Past Millennia, by P.D. Jones and M.E. Mann, Medieval Warm Period and the Little Ice Age Myths)
DENIAL MYTH #8:  The MWP has been ignored in order to produce the desired conclusion (Source: “Apocalypse Canceled”, by Christopher Monckton as well as others).
Debunking: Even if this were true in the past (and the sources for Claim #7 above show it has been addressed repeatedly since the release of the TAR), the IPCC Working Group 1 Report, Chapter 6, Figure 6.10 and Box 6.4, pages 467-469 (shown at right) addresses this specifically. In essence, there is statistical evidence that the MWP was not warmer than the last 25 years (since 1980), but there are enough errors in the MWP data to warrant additional research into the scope (Europe? The entire Northern Hemisphere? Global?) and magnitude of the MWP. (source linked above)
DENIAL MYTH #9: The temperatures we’re experiencing in the later part of the 20th century are a result of the global climate finally coming out of the Little Ice Age (Source: distillation of multiple people’s claims at Wikipedia.org).
Debunking: The Little Ice Age is a period of significant cooling in Europe, but there are questions as to whether this known regional change was truly global in dimension. However, if you look at the graph of the temperature data for the last 2000 years, there is no period where the reconstructed global temperatures have changed at a faster rate than in the last 50 years or so. I refer people to the IPCC Working Group 1 Report, Chapter 6, Figure 6.10 and Box 6.4, pages 467-469 (image shown above in myth #8 above), but also to this NCAR press release that verifies that the basic conclusions of the original “hockey stick” remain accurate even using multiple different models.
DENIAL MYTH #10: There was a significant period of global cooling between the 1940s and the 1970s. This cooling period existed as anthropogenic CO2 levels were rising significantly. If anthropogenic CO2 is more important than natural drivers, then this cooling period would not exist, yet it does (Sources: produced by Rcronk in the comments to Eastern seaboard of the United States to be much hotter, but also made in the Wikipedia.org claims).
 Debunking: That this cooling period existed and was global in scope is not disputable as the scope of the MWP is – scientists were directly monitoring temperatures globally by this point, and these three decades were cooler than the decades preceding them and dramatically cooler than recent decades. So what caused the cooling?
First, there is a correlation between sunspots and solar irradiance (output) on the Earth. During this period, sunspots were less common and there was less solar energy reaching the Earth, allowing it to cool slightly. Second, there were several volcanic eruptions that released massive amounts of sulfur dioxide into the atmosphere. Sulfur dioxide is an aerosol that forms droplets of sulphuric acid in the high atmosphere and reflects solar energy back into space, so these two volcanic eruptions had some short- to medium-term effects. In addition, prior to the 1970s there were limited pollution controls, allowing pollutant aerosols to act as coolants via reflection of solar radiation. Ultimately, though, it is believed that sometime after 1970 the concentration of CO2 rose to the point that solar forcing was no longer the dominant climate factor, anthropogenic CO2 was. (Sources: Do Models Underestimate the Solar Contribution to Recent Climate Change?, Swindled!)
DENIAL MYTH #11: Cosmic rays (very high energy particles) striking the Earth’s atmosphere is the cause of global heating (Source: distillation of multiple people’s claims at Wikipedia.org).
Debunking: According to this theory, cosmic rays are responsible for cloud cover – fewer cosmic rays means fewer clouds and less cooling in the summer (clouds reflect the energy) and more heating in the winter (as clouds hold heat in). Unfortunately, there doesn’t appear to be any statistically significant trend in the number of cosmic rays hitting the Earth, and the few experiments performed to date appear to be stricken with error or a failure to address key points. This could be an aggravating factor, but is highly unlikely to be the primary source of global heating. (Sources: No Link Between Cosmic Rays and Global Warming, Cosmic Rays and Global Warming, Recent Warming but No Trend In Galactic Cosmic Rays)
DENIAL MYTH #12: The Stefan-Boltzmann Law (the relationship between radiation and temperature of an ideal “black body” radiator) breaks the calculations required to make global heating work (Source: “Apocalypse Canceled”, by Christopher Monckton as well as others).
Debunking: This issue was the hardest to make heads or tails of, because the only people who really use it are deniers. That said, Mr. Monckton claims that the real value of lambda (the response of the Earth to radiative forcing) of between 0.22 and 0.33 C/W. But this number is only valid for an ideal black body model of the Earth, and the Earth is not even remotely close to a black body. Unfortunately, because I can’t find examples of the math involved to walk through it, I can’t say that this claim has been as well debunked as I’d like it to be, and as most climate scientists claim it is. (Source: Cuckoo Science)
DENIAL MYTH #13:  Using computer models is inherently inaccurate, especially of long-term changes in a system as complex as the Earth’s global climate (Source: Pretty much all of the deniers use this one, so there are more sources than I care to link to directly).
Debunking: Models are inherently inaccurate – anyone who tells you otherwise is trying to sell you a bad modeling software package. However, models can be made to accurately average out to something that represents reality, and this is the case with the IPCC models. I suggest that everyone read IPCC Working Group 1 Report, Chapter 8, FAQ 8.1, pages 600-601 and IPCC Working Group 1 Report, Chapter 9, page 684 (shown at right) to get a better understanding of how the models work, and the fact that models without anthropogenic CO2 simply don’t match the actual measured temperature changes. For more comments on using models for predictions, see myth #19 below.
DENIAL MYTH #14: The Earth hasn’t warmed by the expected amount predicted in the IPCC TAR, and papers have suggested that oceanic storage of heat is the reason. However, the only part of the ocean that matters as a “thermal sink” for atmospheric heating is the top few meters and yet the calculations performed require that 1.25 miles of ocean are available as a “sink” to make the math work out. Unfortunately, deep ocean temperatures haven’t changed at all (Source: “Apocalypse Canceled”, by Christopher Monckton).
Debunking: First, the Earth has warmed even more than the TAR models predicted (see myth #19 below), not less.
Second, let’s talk about what oceanic depths matter to climate. It’s true that only the top 90 meters or so of the ocean matters to short-term absorption of heat, but because of oceanic currents, the entire ocean does turn over eventually, if very slowly. So the entire ocean must be modeled in order to understand just what the effects of the oceans actually are. Second, the IPCC TAR had to use a depth of 3000 m in order to correctly reconstruct existing temperature data using models, but the latest IPCC report (AR4) uses a depth of 700 m instead, with data correlations between the sea surface temperature, the 0-700 m ocean depth zone, and then down to 3000 m as well. These correlations were not possible back in 2001 when the TAR was released due to lack of data, and the data has significantly improved in the years since. Finally, most of the increase in the temperature of the ocean has bee in the top 300-700 m, and so no, the deep ocean temperature hasn’t changed a lot. Given that the time scales of interest when talking about the deep ocean are in the range of decades to centuries, it’s not a surprise and totally expected. (Sources: NOAA Office of Climate Observation: The Role of the Ocean in Climate, Warming of the World Ocean, 1955-2003, S. Levitus, J. Antonov, and T. Boyer)
DENIAL MYTH #15: The ocean has already begun to cool as expected given recent changes in solar output, cosmic solar rays, etc. (Source: “Apocalypse Canceled”, by Christopher Monckton).
Debunking: A 2006 paper by John M. Lyman, Josh K. Willis, and Gregory C. Johnson published in Geophysical Research Letters suggested that the oceans had lost a massive amount of heat (~20% of all the heat it had absorbed since the 1950s) without the heat apparently going anywhere. This was latched on to by many global heating deniers to suggest that the ocean had begun to cool as required by numerous suggested methods to account for purely naturally-driven global heating, or that the estimates of ocean heating were just plain wrong. Unfortunately, Dr. Lyman and his colleagues discovered that, while they’d accounted for measurement errors, they’d missed measurement biases (deterministic offsets in temperature inherent to the equipment measuring it) in their measurement devices, and the data will have to be corrected to account for this bias. Until then, however, there is no reason to believe that the unexpected cooling will actually be anything more than a glitch in need of correction. (Source: Correction to “Recent Cooling of the Upper Oceanâ€)
DENIAL MYTH #16: Global heating isn’t actually happening because satellite measurements of tropical temperatures have not been rising like directly-measured temperatures in the tropics (Source: distillation of multiple people’s claims at Wikipedia.org).
Debunking: The satellites used to measure tropical temperatures remotely were discovered to have been drifting in their orbit, producing temperature measurements that were not during the day as expected, but rather during the night, confusing the cooler evening and nighttime temperatures with warmer daytime temperatures. The paper this comes from is “The Effect of Diurnal Correction on Satellite-Derived Lower Tropospheric Temperature” by Carl A. Mears and Frank J. Wentz of Remote Sensing Systems. Unfortunately, there is not a .pdf of this document available that may be freely distributed. However, this was reported in U.S.A Today and Live Science, and if you search Google for “satellite balloon data error global warming” you’ll find a lot more.
DENIAL MYTH #17: Some deniers don’t directly dispute that global heating is happening or that humans are the cause. Instead, they claim that global heating might just be good for the human race (Source: distillation of multiple people’s claims at Wikipedia.org).
Debunking: The effects of global heating have been investigated by many people and organizations with specific concerns in mind, ranging from the economy to public health to population migrations to political stability. Below is a sampling of the organizations who believe that global heating will not be good for the world and why.
- The Pew Center on Global Climate Change published “U.S. market consequences of global climate change in April 2004 where they estimated that global heating would be, using the most optimistic assumptions, a temporary boost to the U.S. economy by 0.7 to 1% by 2100, but that the most pessimistic assumptions would produce a reduction in GDP of approximately 3.0%. In addition, the benefits are almost exclusively in the agriculture and energy sectors and increasing temperature will ultimately reverse the gains in both sectors.
- According to Climate Change 2007: Impacts, Adaptation and Vulnerability, Working Group II Contribution to the Intergovernmental Panel on Climate Change Fourth Assessment Report – Summary for Policymakers (the full report is not yet available online), droughts will become more common as freshwater from melt and precipitation decreases, 20-30% of plant and animal species will be at increased risk of extinction and acidification of the ocean will adversely affect marine ecosystems, global agricultural productivity will increase slightly and then decrease as temperatures continue to rise, coastal flooding will cause serious problems (especially in Asia), and developing countries will be heavily hit by droughts, disease, and rising sea levels
- Lloyd’s of London, a major global insurance company and hardly a hotbed of liberal activism, released this 360 Risk Report titled “Climate Change: Adapt or Bust”. The gist of the report is that climate change is going to cause major losses to insurers if the risks aren’t managed carefully, and that the risks must be managed by working with businesses and governments as well as by updating internal risk models to account for a changing global climate.
- The CNA Corporation released a report on “National Security and the Threat of Global Climate Change.” The report is somewhat alarmist and the time scales described may be too aggressive, but the point that global heating will cause significant instability and impact U.S. national security is valid nonetheless.
- In a Pentagon report titled “An Abrupt Climate Change Scenario and Its Implications for United States National Security,” the authors propose an abrupt climate change situation that is unlikely but plausible and that results in massive food shortages, disruptions in energy supplies, droughts, and possibly even wars over access to fresh water, mass population migrations, and energy.
DENIER MYTH#18: The influence of CO2 cannot match the influence of water vapor, and since the impacts of water vapor are largely unknown and outside direct human control, human beings cannot be the source of global heating (Source: Comments on Digg.com’s post about this blog originally, but scattered around the net as well).
Debunking: First off, there is no doubt that water vapor is directly responsible for the bulk of the greenhouse effect (~60% according to Table 3 of “Earth’s Annual Global Mean Energy Budget”). As such, water vapor could far outweigh the direct effect of CO2 in the atmosphere. Unfortunately, because of the complexity of the Earth’s water cycle, figuring out what the effects of water will be isn’t simple.
 As the atmosphere heats up, it can hold more water vapor. As such, we can reasonably expect that the hotter the air is, the more humid it can be and, because water vapor is the most powerful greenhouse gas, the hotter the air will get. This positive feedback leads us to an obviously erroneous conclusion – that we should already be boiling. Since we’re not, there must be something that provides negative feedback to at least partly compensate for the positive feedback, and there is – precipitation in the form of rain, snow, sleet, hail, etc. Small local variations in temperature can create massive differences in the amount of water vapor present in the local atmosphere – a hot high pressure system drives the humidity down and stops precipitation, while a cooler low pressure system permits condensation and then rain or snow. All in all, this means that water vapor that enters the atmosphere persists there a very short period of time – about 11 days (see the right sidebar – while CO2 persists in the atmosphere for decades to centuries.
Now, since people can’t directly control water vapor, the only way we have to influence it is via temperature. If the greenhouse effect boosts global temperature somewhat, we should realistically expect that the amount of water vapor in the air should be increasing. Similarly, if global temperatures drop for some reason (for example, a large volcanic eruption dumping massive amounts of aerosols into the air), we should expect to see water vapor concentrations decrease. In the lower atmosphere, the available data points to increasing water vapor content, but because of large variations in local humidity from day to night, from day to day, and from season to season, no-one currently knows exactly how much more water vapor is going into the air (IPCC Working Group 1 Assessment Report 4, Chapter 3, “Observations: Surface and Atmospheric Climate Change”, page 273). And unfortunately, the upper troposphere (the region of the atmosphere believed to be most important for water vapor’s effects on global heating) has no conclusive direct data on water vapor concentrations. Instead, the increase in water vapor in this part of the atmosphere has been indirectly checked by the increase in this region’s temperature. Since water vapor is such a powerful greenhouse gas, any increase in temperature in this region of the atmosphere should be largely a result of the effects of water vapor (IPCC Working Group 1 Assessment Report 4, Chapter 3, “Observations: Surface and Atmospheric Climate Change”, Figure 3.21, page 275).
But perhaps most importantly,  the fact that the concentration of water vapor does increase and decrease along with external temperature changes was proven as a result of the 1991 eruption of Mount Pinatubo. The temperature dropped for several years, and the amount of water vapor in the atmosphere dropped at the same time, and roughly in the same pattern (Figure 2, to the left). When the authors of the paper looked at their general climate models,
  they discovered that, once they corrected for an El Nino that occurred right after Pinatubo erupted, the model only produced roughly equivalent cooling if water vapor feedback was included in the model (Figure 4, to the right).
What does all of this mean? Basically, water vapor is a more important greenhouse gas than CO2, but because CO2 will cause heating independently of water vapor, as man-made CO2 increases global heating, water vapor will increase too, boosting the amount of warming with a positive feedback loop. How much exactly is up for debate, and there’s not a long enough data series on water vapor in the atmosphere to know everything. But just because humans can’t increase or decrease water vapor in the air directly doesn’t mean that CO2 heating of the air won’t do so indirectly.
DENIER MYTH #19: We don’t have enough climate data to make valid predictions of any kind. We have so many problems predicting the weather that there’s no way we’ve got enough data to predict how the entire climate functions (Source: multiple sources).
Debunking:  Allow me to draw a detailed analogy from my professional field, electrical engineering. Please bear with me – I’ll try to keep the math and technical jargon to a minimum. The image to the left shows a simple electrical circuit called a difference amplifier. Using two fundamental relations derived from some of the laws of physics (specifically Kirchoff’s Voltage and Current Laws, derived from conservation of energy and conservation of charge respectively), and knowing a couple of key bits of information about resistors and operational amplifiers (op-amps), we can crunch through some basic algebra to come up with the following equation that describes mathematically how the output voltage VOUT is related to the input voltages VIN1 and VIN2.

If you notice, the name “difference amplifier” comes from the fact that VOUT is related to a difference between VIN1 and VIN2, and in fact if you select the resistor values correctly (R2=RF, R1=RG), you get a simplified equation below.

Given that I’ve described the circuit mathematically, do I have enough information to accurately predict how the circuit will respond? Yes and no. This equation accurately describes the operation of the circuit if the circuit perfectly represents reality.  But the circuit doesn’t perfectly represent reality. Reality is quite a bit more complex, as the image shows. This circuit illustrates a much more accurate picture of reality in that it includes terms such as bias current, offset current, and offset voltage, and this equation is the corrected equation for the operation of the circuit (this equation is still missing two of the larger corrections, input and output resistance, because I didn’t want to re-derive the equations – it gets really tedious really fast).

But sometimes that’s still not a good enough model of reality. Every single term is a function of temperature, so as the temperature of the op-amp and the resistors change, their values change. Not only that, but depending on the precise nature of the parts, how the parts change with temperature will vary – some will increase as temperature increases, some decrease, some increase for a while and then decrease, some don’t change at all. Not only that, but if the circuit is expected to operate for an extended period of time, every term (including the temperature term) may change totally differently as the part ages. How each component operates varies with air pressure, humidity, radiation exposure, proximity to electromagnetic interference, how the component is packaged, what materials it’s made out of, mechanical stresses, manufacturing imperfections, device noise, input noise, and power supply variations. And this list is still too small to include all the possible variables – it’s just the list I came up with after 10 minutes of thinking of all the factors I’ve been expected to consider over the years. There are probably dozens more I haven’t even considered. Given the massive number of factors that might, or might not, affect the operation of the difference amplifier above, it’s simply not always possible to make detailed and exact predictions of how it will react at any given instant even though the circuit’s gross functionality will alway be predictable.
 Predicting climate using models is like me predicting how the difference amplifier works at a basic level – I don’t need to know how the exact devices will react to air pressure and temperature in order to derive the basic equations. But if we want to use climate models to predict the weather, that’s a lot more like me trying to predict how my difference amplifier will operate given every possible input condition and variable.
We don’t need to have all the data in order to have valid predictions. We need to have an understanding of the basic physics, the basic feedback and forcing mechanisms, and of the inputs and outputs of the Earth’s climate system. Climate scientists have a great deal of this information and have included it in the climate models (the illustration above illustrates the progression in increasing model detail from early models to the latest used by the IPCC). The climate models aren’t perfect, but neither are the basic equations of a difference amplifier circuit.
 Do we have enough data to be able to claim, as I have, that the climate models are good enough to qualify as “basic equations”? Well, the IPCC Working Group I Fourth Assessment Report Summary for Policymakers says that they have “very high confidence,” 90% or more (see the image to the right for how the IPCC AR4 defines all the various confidence levels), that human beings have heated up the planet since 1750 (
 Box TS.1 on page 22-23 of the describes the percent confidence/likelihood indicated by the language). The Summary also says that the data and models have improved since 2001 when the likelihood was only “likely,” or greater than 66%, that humans were causing global heating (see the image to the right for how the IPCC Working Group I Fourth Assessment Report Technical Summary defines different likelihoods)
 What increased the likelihood in the view of about 620 authors representing 42 different countries? It was partly that two of the key predictions of the IPCC Third Assessment Report (TAR) were accurate when compared with the actual data. First, the IPCC predicted that the temperature would increase by about 0.5 degrees C as per the image to the left. If you look at this blown up image, you’ll see that the actual data, approximately 0.7 degrees C, exceeded the global expected change significantly (indicated by the orange intersection I added).
  Some variation from the model over the short term is reasonable, so the fact that we’ve exceeded the expected range isn’t necessarily cause for concern that the models are underestimating global heating. Second, the TAR predicted that sea level would rise by between 1 and 5 cm from 1990 to 2006, with the expected range from the models somewhere between roughly 2.5 and 4 cm (Click on the image below for a more readable blow-up). If you look at the red and blue lines representing ocean station data and satellite altimeter data, you’ll notice that both track very closely to the maximum, but are both within the range of the IPCC TAR model.
 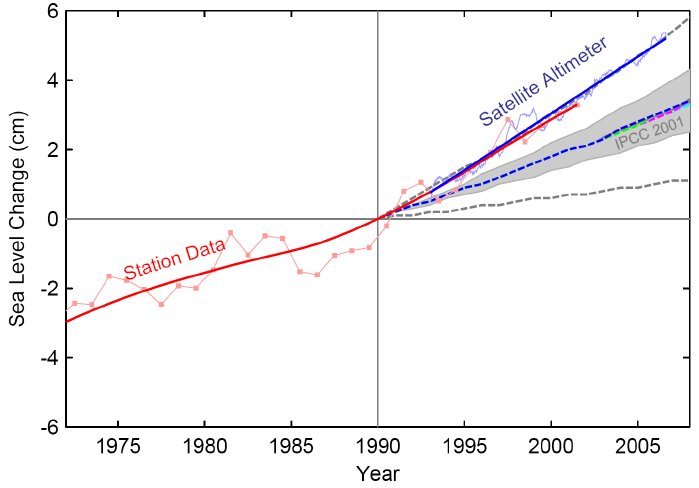 (Unfortunately, there’s significant confusion and contention about whether the TAR and AR4 models are similar, whether the unknown factors are included or not. See here for one side of the discussion, here for the other.)
In addition to the data closely matching the models, the scientists also have five or six more years of climate data of all types, improved data due to better measurement techniques, and more data from a wider geographical area. Combine the new and improved data, measured correlation between the old models and the new data, and improved climate models that, when properly vetted and compared with historical climate reconstructions, and you end up with a very compelling global heating theory that has convinced 620 authors from 42 countries that both the theory and the predictions are accurate. (Other sources: Real Climate’s page on sea level rise)
DENIER MYTH #20: Volcanos emit more CO2 in a single eruption (or per year) than humanity does, dwarfing anthropogenic emissions (source: comment below by BobCook)
Debunking: Volcanoes emit a lot of gases, including significant amounts of CO2. Unfortunately, according to papers from back in the late 1990s, “Volcanoes contribute about 110 million tons of carbon dioxide per year while man’s activities contribute about 10 billion tons per year.” This means that anthropogenic CO2 emissions are 100x greater than volcanic CO2 emissions. In addition, as mentioned above in myth #18, volcanoes generally cause global cooling through the emissions of cloud-forming sulfur dioxide and water-cycle feedback. Finally, the USGS says “The most significant impacts from these injections come from the conversion of sulfur dioxide to sulfuric acid (H2SO4), which condenses rapidly in the stratosphere to form fine sulfate aerosols” at this site
Over geologic time, volcanoes and mantle outgassing have emitted more CO2 than humanity ever will, but that’s over the course of 4.5 billion years. See myth #1 above for more information.
Additional information for how volcanic CO2 emissions compare to anthropogenic CO2 emissions is available at Gases: Man vs. the Volcano.
DENIER MYTH#21: Ice core data illustrates that CO2 has previously always risen after temperature increases, not before as scientists are claiming is happening now. Therefore any global heating we’ve experienced is already over and we should start cooling down soon. (sources: Multiple)
Debunking: There are a number of problems with this argument – a logical fallacy, an inaccuracy with regard to the time scales involved, and a misunderstanding of how the transitions in question (deglaciation, or going from an ice age to an inter-glacial period) are understood to work.
First, the logical fallacy is known as “predictive appeal to history,” and it relies on the “it’s always happened this way in the past, so it will always happen this way.” Or, to steal an analogy that a commenter on Digg used, if you push your foot down on the gas 10 times and the car accelerates each time, you can realistically expect that the next time you put your foot down on the gas the car will accelerate again. That’s science. But what if you put your foot on the gas and nothing happens? Assuming that that car would have accelerated was a reasonable scientific expectation, but once the car didn’t accelerate, you have to leave your prediction behind and actually figure out what’s busted in the car. Or, to put this analogy in terms that more directly parallel global heating, what if you’re sitting in the car and it accelerates even before you put your foot on the gas? Did you accidentally put your foot on the gas and not realize it? Or has something broken under the hood that you’ll fix before you can slow down again? In the case of global heating, the Earth’s atmospheric CO2 took off before the temperature started rising, and scientists have identified that the differences this time around are human-caused, or anthropogenic (See Myth #3).
 Relying on prior history to generate predictions only works when everything is equal and the situations are substantially identical. What we have today in the case of global heating is not substantially identical in a scientific sense to prior episodes of heating in the past. Without CO2 produced by the burning of fossil fuels, the natural atmospheric CO2 concentration would be approximately 280-290 ppm instead of the approximately 383 ppm it is today. As the image at right shows, modern human civilization itself has made the situation substantially different from prior climatic cycles.
The second problem is that proponents of this myth are confusing different time scales. It is true that the Vostok ice core has illustrated that there is a delay of between 200 and 800 years between a change in temperature and the lagging change in CO2. However, this change is only observable at transitions between periods of glaciation and interglacial periods where the changes are of sufficient magnitude to overcome the uncertainties in the measurements and proxies used to estimate temperature, CO2 concentration, and age. Part of the lag is due to the fact that gas bubbles are trapped in ice that is older than the air trapped. Another part of the lag is due to the time required to heat up the ocean enough to start outgassing CO2 (see Myth #2). Other sources of lag could be the time required for the ocean to mix vertically, for sea-ice to melt, for oceanic biological productivity to change, and/or for the concentrations of atmospheric dust to change (“Timing of Atmospheric CO2 and Antarctic Temperature Changes Across Termination III”, Science Magazine #299). However, even then the lag is but a small percentage of the total time required to deglaciate the planet, specifically between 200 to 800 years in a deglaciation that lasts 5000 to 6000 years.
But the time scales are even more impressively different when you consider the magnitude of the changes and how fast they’ve occurred. Across Termination III described above, the concentration of CO2 increased from 240 ppp to 280 ppm over the course of approximately 5000 years, or at an average rate of 0.008 ppm CO2 year. Since 1850, the concentration of CO2 has increased from about 280 ppm to about 383 ppm, or at an average rate of 0.656 ppm CO2 per year.
Finally, it’s understood that prior climate changes were not driven by human activity since there was no human activity to drive them. However, as the article linked above shows, this doesn’t change the fact that CO2 is believed to have played a significant role in the very same transitions used to support this myth. According to the article, deglaciation Transition III in the Vostok ice core started with the melting of Antarctic ice driven by some change in solar forcing, followed by an increase in global CO2, and then by the melting of Northern Hemisphere glaciers. The paper’s authors clearly state the implication:
This confirms that CO2 is not the forcing that initially drives the climatic system during a deglaciation. Rather, deglaciation is probably initiated by some insolation forcing (1, 31, 32), which influences first the temperature change in Antarctica (and possibly in part of the Southern Hemisphere) and then the CO2. This sequence of events is still in full agreement with the idea that CO2 plays, through its greenhouse effect, a key role in amplifying the initial orbital forcing. First, the 800-year time lag is short in comparison with the total duration of the temperature and CO2 increases (~5000 years). Second, the CO2 increase clearly precedes the Northern Hemisphere deglaciation (Fig. 3)….
…The sequence of events during this Termination is fully consistent with CO2 participating in the latter ~4200 years of the warming. The radiative forcing due to CO2 may serve as an amplifier of initial orbital forcing, which is then further amplified by fast atmospheric feedbacks (39) that are also at work for the presentday and future climate.
In other words, even if prior changes in climate weren’t started by increased CO2 concentrations, more CO2 in the air continued the deglaciation.
Has CO2 concentrations lagged temperature in the past? Yes, the ice cores show this quite specifically on a glacial/interglacial timescale (hundreds of thousands of year). But what’s happening to the atmosphere today has no analogue in the past. Deglaciation transitions occur due to changes in CO2 concentrations that are both smaller in magnitude than modern anthropogenic changes (40 vs. 103 ppm) and slower in duration (~5000 vs. 157 years). Because the rate of change in CO2 concentration appears to be unprecedented, we cannot rely exclusively on paleoclimatic data to explain what’s happening today. Instead climate scientists have developed scientific predictive techniques (aka computer climate models) that are informed by the paleoclimatic data we have, but that also incorporate the differences between the climate of modern humanity and the analyzed paleoclimates into their analyses.
In essence, human civilization jammed the climate accelerator and the usual planetary brakes aren’t enough yet to keep us from accelerating. (Other sources: Atmospheric CO2 Concentrations over the Last Glacial Termination, New constraints on the gas age-ice age difference along the EPICA ice cores, 0–50 kyr)
At one point or another, each of these claims represented a real problem with the science of global heating. But no longer – the scientific evidence has become overwhelming. However, it’s the minority composed of global heating deniers who continue to hunt for flaws in climate science, so the deniers serve a valuable scientific purpose – when they find a real hole, or just think they have, addressing their claims are what has made the science of global heating as bullet-proof as it now is.
It comes down to this simple fact: the overwhelming majority of the scientific evidence points to human-induced global heating, and every claim made by global heating deniers has been effectively debunked. And because the consequences of doing nothing are so severe, we must act now even as the data continues to improve – we can no longer afford to wait.
NOTE: This post was inspired by one of Whythawk’s posts entitled Life Earth will end climate change the way Live Aid ended poverty in Africa – Er… where one of the comment posters, “2008Voter”, posted the links to some of the sources used for this blog.
Categories: Environment/Nature, Science/Technology


Congrats on the thoroughness of your investigations 😉
I’m concerned at the tone of the Climate Change debate, it has terrible parallels with South Africa’s president, Thabo Mbeki’s, denial of the link between HIV and AIDS. So much time has been spent on “proving” the link and, in the mean time, South Africa has lost the battle, dooming almost 20% of the population to death.
The same is happening with climate change; too much time is being spent arguing on whether or not humans are to “blame”. I don’t imagine that HIV was unleashed on the world as a punishment for people any more than climate change.
It is a thing. Let’s deal with it.
We can’t berate, on the one hand, the problems of the 60% of the world’s population who are in poverty, while on the other denying them access to the technology they will need to become rich. Energy consumption and increasing wealth go hand in hand. Demanding that we all make sacrifices may result in some rich countries pretending to do things (Europe, which has signed up to Kyoto but has done little practical terms) while China and India ignore it entirely.
I like the competition that Richard Branson is sponsoring to reward companies that come up with new carbon sequestering ideas. Maybe it should be made larger and more exciting.
And let’s not be so dictatorial about it, no greater worthy than James Lovelock, who invented the Gaia theory, has demanded that nuclear power form part of any response to climate change.
I agree with you completely that we need to give the developing world access to the energy that will enable them to grow their economies, improve their public health, etc. And so they need to be provided (not necessarily given) with technologies that give them that energy but does so in a reduced carbon/carbon neutral fashion. There are massive challenges in the developing world that must be overcome in order to build clean power, but they also have a massive advantage that the developed world does not – their slate is largely clean, so they have the option of jumping right in and skipping over some of the dirtier technologies that the developed world has to upgrade without disrupting their economies.
Our civilization is nearly totally dependent on carbon right now (something else I’ll be blogging on in depth in the next few weeks), and that needs to change. I’m actually a proponent of carefully propagating nuclear power to the developing world. It has to be done right, and I’m pretty sure that the current IAEA isn’t up to the task, but without nuclear power as at least a bridge technology, there’s no way that we’ll successfully decarbonize our civilization in time.
Good point about developing nations and skipping steps. When we went to the Molly Brown house a few weeks ago they mentioned that Denver was the 4th city in the US to have electric street lights. Not because Denver was incredibly progressive, but because unlike established East Coast cities, we hadn’t already invested a fortune in gas lights. We were smaller and just starting out, so it was easier to adapt the new technology on a city wide scale.
The true difficulty may be that BOTH sides are correct. Consider the following scenario.
Thorough thousands or even millions of years, the earth goes through warming and cooling cycles. In general, except for an occasional asteroid strike, catastrophic volcanic eruption, and the like, the atmosphere easily absorbs these changes and life moves on.
Then along come humans. For several thousands of years, they are merely a minor annoyance to the plant before becoming a menace to themselves and everything around them. In time, increased human activity coincides with one of the natural upswings in temperature, and exaggerates the effect – pushing it over the top.
The natural rhythms are overwhelmed. The cycles behave erratically as they try to make adjustments. In all the wild environmental shifts, humans die off. Nature merely reacted to their presence as it would to a prolonged asteroid strikes or series of volcanic eruptions.
With humans out of the way, nature eventually recovers. Nature doesn’t miss humans very much and never really need them anyway. Once again, life moves on as it did before humans arrived on the scene.
The simple fact of life is humans really aren’t very important except to themselves.
Threebells, there’s no doubt in my mind that there are natural cycles – the data shows that they occur. So at some level you’re right, human-caused global warming is added on top of the natural cycles. But I see no reason why we shouldn’t try to manage our environment so that humanity en toto lives longer. Is it selfish? Yep, and I’m ok with that. I’d like for descendants to have a life that is at least as rich as my own.
For me there’s no debate: of course we must manage our environment. Humans, I would like to believe, are destined to become a space-fairing species. We will have to control environments where-ever we colonise.
There is permanent discussion about colonising Mars. I fully believe that this will happen within the next 100 years and that, within 200 Mars will have an Earth-like atmosphere stable and sustainable. Possibly with Virgin Mars trips once a week 😉
What we learn here about how to preserve ourselves is useful everywhere.
Thank you thank you thank you.
I’m certain I’ll reference this. I’ve bookmarked it under ‘globalwarming’ on delicious. I’ll likely blog it later today.
-kevin
—
http://www.21st-century-citizen.com
8. Whythawk – I agree with you entirely. I’m not sure about the time scale of giving Mars an atmosphere that fast, but that’s a pretty minor quibble.
9. Kevin – you’re welcome. I’m glad you found it useful. My biggest surprise in the process of doing the research for this post was that something like this didn’t already exist. Realclimate.org has most of the information, with references, but because the scientists associated with that website developed the infamous “hockey stick” (that I’ve already been criticized for using on Digg.com, BTW), too many deniers have a knee-jerk rejection when they come up. And it’s not easy to find it all even there. And their “global warming myths” doesn’t have all the stuff that’s being used against them these days.
Thanks Brian –
I agree realclimate.org has some great content. I’ll be adding you guys to my blogroll and following your site. I’ve been here before, but can’t remember how long it’s been.
BTW – I also stumbled this page. Hope you see some traffic.
Count me in as a denier, flat-earther, whatever the current name-calling standard is.
I appreciate the post, however. Nothing like a well-researched piece of text to help out both sides of the debate.
I would like to point out, however, that it’s not like every charge has to be proven false. If even one charge is found to be true, the whole thing falls apart. As a computer expert, I’m specifically concerned about the amount of faith the public places in anything that has the words “scientist” and “computer model” in it. If the input and output data are available to build and test models, based on just a few decades of observation, then I’m Captain Kangaroo.
Making a case like you have made is basically a political argument, where much of this debate lies. The science is either based on theory and predictive or it is not. I haven’t seem an average temperature or ocean level prediction for the year 2020, so to me it’s all just a general feeling that most scientists have, gussied up with the appropriate symbology.
Thanks again for the post.
Ain’t math wonderful, Brian? Very, very nice work.
“If even one charge is found to be true, the whole thing falls apart.”
That’s not true at all. Not all claims are equal in importance. For example, if solar irradiance is found to influence climate (this is a “duh” statement, IMO), then the question is one of degree of influence, not the existence thereof. Stott et al (link above) point out that solar irradiance probably dominated climate shifts up until the late 1960s or 1970s, where anthropogenic CO2 took over.
The thing about the models is that they are predictive. The models have used measured data and reconstructed temperatures from proxies (tree rings, ice cores, boreholes, sediments, etc.) and been calibrated against at least the last few thousand years of data, and they all predict that the temperatures will continue to rise. The IPCC makes temperature predictions in their Global Climate Projections, Chapter 10. Figure 10.2 on page 757 has the projected radiative forcings for every 20-year chunk of the 21st century. Figure 10.4 on page 762 shows the predicted temperatures for the various scenarios that the IPCC modeled. Figure 10.5 and Table 10.5 on page 763 have even more data if you’d rather see the individual model runs instead of the average of all the models that Figure 10.4 shows.
The problem isn’t making predictions so much as it is the limitations of the climate system – when you’re low-pass filtering (averaging out a decade’s worth of temperatures, for example) temperatures to extract trends out of the year-to-year noise, you’re always 10 years behind. And the predictions are sufficiently bad that we can’t really wait 10 years to start actively managing the environment.
What I find interesting is how many people boil down environmentalism to “global warming”. Even if global warming was proven one day to be a complete fallacy, wouldn’t conservation and reduced pollution still be a good thing? The exact same actions that would reduce global warming would also preserve general air & water quality, reduce the levels of toxins in our food, ensure we have energy to meet our demands, reduce erosion, and maintain wild places for us to enjoy.
16. Lara, thank you for making that excellent point. That’s part of why I don’t generally talk about “environmentalism” much any more – protecting the environment is about public health, energy, food safety, pretty places to hunt, fish, hike, and camp in rather than protecting it for its own intrinsic value. Which isn’t to say that the environment isn’t intrinsically valuable – it is – but rather to say that “environmentalism” has very effectively been given a bad rap, so reframing the discussions can be very, very useful.
Well at least we can agree that GW is being used by some as a “re-framing” for environmentalism. It begs the question of whether human activity is natural or not. Are we simply arguing where to put the thermostat? Or are we somehow morally culpable, “parasites on the earth” as one correspondent put it?
I do believe that if any of these factors play a conclusive role in climate change that the cat is out of the bag. As you point out, however, it’s a complex thing — probably multiple factors — so we’re just arguing semantics.
I’m really curious as to how you view the models as predictive. Core data and other forensic climate methods are notoriously location-specific. You’re only getting data from wherever the sample was taken. And the predictive capability would be limited to those places where you have readings. It’s not like you have global data going back anywhere past 1950 (or 1850 if you have looser standards). So measuring from a small number of sites can give you input data for global climate? That’s quite a statement. Amazing, even.
I believe we’re probably warming the planet. But I believe that in the same exact way I believe the Steelers should win the Superbowl, or that sushi is better than Mrs. Paul’s frozen fish. This argument is at a stage of “preponderance of the evidence” and personal choice, not science.
I look forward to testing the model’s prediction in the first 20 years. At that point, perhaps the underlying theory will have caught up with the statistical modeling process. I’ve heard the arguments and remain unconvinced. Now — either somehow I’m intellectually challenged, being paid-off, still missing some key facts, or there is something to my caution. I’m open to your evangelism, however. Keep up the faith. There’s nothing we all can’t do with civil reasoning and logic.
Brian,
Thanks for this incredible piece of research and writing. Just valuable stuff….
Just like you I think its about time we had a static climate.
We need to do everything we can to ensure things never change – except everything that has changed up to this point in time – but nothing else should ever change.
We should never see another animal go extinct, or another develop. We should never see another island be created or an enviroment change – such as a desert becoming grass land as has happened in the past.
Finally, we need to ensure that we have something we can use to prove that it is man who is causing things to change when they do. CO2 is the best substance we have because it is such a small percentage of the atmosphere – but is a crucial part of life – so it will always be something we can point as.
Keep up the good work, but make sure you delete the file if we end up in the same situation as a few years ago when global cooling never happened. That Newsweek article from 1975 is still quite embarrassing! 🙂
Great Stuff! Thanks for this… we need tough talking now and a basic simplicity. Global Climate Change IS happening. Its time to stop wasting time and resources on proving it is not and, instead spend time on resources on stabilizing our biosphere before its too late.
Valuable article; comes in handy for arguments.
I posted a link to it on the high-traffic http://www.opednews.com/.
Under “Best Web Op-Eds.”
Thanks a lot, Russ.
“In addition, if a hotter ocean were the cause of CO2, we would also see increasing concentrations of other dissolved gases such as oxygen,”
Technical point: Equilibrium O2 concentrations in water drop with increasing temperature. (Negative delta S on dissolution).
Otherwise, good article.
I’m sorry it wasn’t clear – I was trying to say that we’d see increasing O2 concentrations in the atmosphere, not in the water. I’ll clarify the language. Thanks for catching that.
“The idea is that the brand new Appalachian Mountains eroded so fast, and in the process pulled so much CO2 out of the air, that it caused global temperatures to plummet”
There are alternate explanations: most of the land mass was at the poles, and solar output then was lower than now. Crowley (forget reference) did a model in, oh, the mid-1990s where he was able to model massive glaciation in the Ordivician with lower solar output, land at the poles, and 12x current CO2 concentrations.
The Ordovician claim is the one I had the most trouble with, and the one that is debunked the least effectively (and one I’ve been getting beaten up on for at Digg). Thanks for the comment – it’ll help me research a better response.
Nice work, Brian.
Check out my version of something similar, a little more comprehensive, at http://gristmill.grist.org/skeptics or at my own blog (click my name)
Brian,
You couldn’t possibly leave out “Global Warming Stopped in 1998”. That one got used on Australian TV a few weeks ago. Despite the fact that it has been shown so many times, by so many people to be completely false, it is still doing the rounds.
Good work on your site!
ChrisC, sure, I can add that one. Not a problem.
Coby, thanks for that link. Great stuff. I’m thinking of adding a list of links to other sites that go after all these claims too even as I add more stuff here.
Got the reference to the Crowley paper (there also appears to have been replications of this work, so track down cites also):
JOURNAL OF GEOPHYSICAL RESEARCH, VOL. 100, NO. D1, PAGES 1093
What brazen nonsense. The Earth is slowly heating up (and someday will go in the other direction of cooling down) because the earth periodically goes through both warming and cooling cycles.
But the current heating is not caused by man. You go through a lot of machinations to debunk anti-manmade-global warming arguments, but you are unconvincing and your arguments irrelevant.
When you make an astounding claim that man is warming the earth, then the burden of proof is on you. You have not proved your case.
Manmade global warming is a hoax.
Actually, Gary, the earth is heating up fast and there is a massive body of evidence that the current round of heating is reversing a long-term cooling trend over the last 2000 years.
The “extraordinary claim” was made back in the 1980s (maybe even earlier) by a number of scientists who were both fairly and correctly greeted with great skepticism of their hypotheses. Since then, literally thousands of papers have made this case very carefully, tens to hundreds of thousands of climate simulations have been run, model errors have been corrected and resolution improved, hundreds of problems in the science have been corrected and claims that humans aren’t the source have all been addressed.
The science has reached a point where the extraordinary claim that requires extraordinary proof is no longer that human beings are the dominant factor in modern climate change, but rather that we aren’t.
i’ll add my 2c, why the hell not, it’s out of control anyway.
first – there is that little issue of nuclear power someone brought up – well what about the waste? what to do with the waste? oh, i hear your answer – “don’t worry just get on with the solution and save everyone” – then we can swim in nuclear waste, instead of CO2.
has anyone EVER – EVER considered reducing our energy demands, instead of trying to keep up with increasing demand? uh-oh, that might mean eveyone slowing down the economy, chaos. we can’t save ourselves, because so-doing would kill us. omg.
you talk about gas powered street lights vs electric. TURN OFF THE DAMN STREET LIGHTS. if that scares you because our natural environment is dark at night, then perhaps SOCIAL change and education can help. but NOPE. technology to the rescue. let’s light up the sky 24/7, and fill the atmosphere with CO2, to solve that pesky “darkness” issue.
what a farce. and there are actually people on this comment list who are STILL openly denying that humans are damaging this planet much much faster than we ought to.
SHAKE YOUR HEAD. humans possess a unique gift – of being able to EVALUATE a situation, and CHOOSE to act differently, thereby CHANGING THE OUTCOME.
you could use this power – change the way you act, and we can improve the world’s situation.
so what the hell is the problem here folks??? who would argue AGAINST fixing the environment?
consider though, this simple example:
suggestion: go vegetarian – it’s good for the environment.
– but wait – oh yeah, we have taught our society that that is lame, feminine, wierd, difficult, bad, and most importantly – not freedom of choice.
we have put freedom of individual choice as a higher achievement, and in fact a higher human “right”, than making community choices.
i.e. –> no one can “TELL ME WHAT TO DO”. i will feed cattle wheat, and then eat the cattle – at HUGE expense to the environment, and absurd energy waste – BECAUSE I HAVE THE RIGHT TO. what a joke.
well, i tell you that’s just an example, we all know there’s a big problem there.
so, no one wants to REDUCE energy demand, it’s not even on the table.
our society teaches that saving on taxes is a successful idea. that earning profits is devine, and more important than sense itself. it justifies almost any action.
power has been handed to those among us who are captivated by individual greed, and are grossly unaware of scientific realities, and are grossly incapable of choosing the long-term sustainable solution.
do you think anyone is going to want to shut down the economy now?
do you want to lose your job today? are you willing to make ANY small sacrifice from our absurdly greedy life?
our society is in a state of psychosis (farley mowat). one primary effect of being in psychosis, is being UNAWARE that you are in psychosis. very difficult to solve.
why do schools teach computer science so intensely, but sustainable nutrition, community services, sustainable living practices are given but a mockable, terse, glance.
???
computer science will get you a job.
so quick – BUILD ANOTHER DATACENTRE. forget about those birds nesting grounds – i’ve got some damned mp3’s that i need to share, and a stupid video to show everyone. sell more computers guys – good work. people have got supercomputers in their homes, but they can’t figure out why black bears are suddenly migrating. or why bees are disappearing from europe.
when the bees are gone – pollenation of wildplants will go too, think it through.
but nope, your’re too busy. “sorry, i’d love to help the environment today, but i have to go to work”
OMG. it’s a shame that only *some* of our species can evaluate this situation and say, hey wait a minute, if we all just try a tiny tiny bit, we could have an awesome world – but then the other 99.9% of the population come thundering in like idiots and crush everything in their path in order to get to some shiny object on the horizon. too bad that object is a mirage.
guess what – money is actually just coloured paper. trees breathe out real oxygen.
too bad for what will happen to this planet, i forsee not much chance of change. why heck, i can’t even imagine my neighbour getting rid of his air conditioning, never mind our entire society re-evaluating what is TRULY LOGICAL AND IMPORTANT.
we stand at the edge of a most unusual epoch in history.
Just excellent, all of it. I just wish the majority could see out of the delusion and break the spell. Even those who are awake, like you tree, have to fight to stay awake in a global system that makes it all but impossible to make planet friendly choices….even when you try….you soon discover how difficult it is to do because of the chain involved in everything we consume.
One of the reasons people don’t act on an individual level is because at some point in the past the human race became entombed in economic slavery, and due to a now huge global population, now must have money to survive.
Obviously with a vast global population, and dwindling, polluted or destroyed resources, it is impossible for the majority of us to now go and live on the earth in a natural way that doesn’t harm the earth’s current systems. How can we? If we all left our jobs and went to live in the forests as human beings used to do before deforestation removed most of them…well you know how that would turn out for the Earth’s few remaining natural environments don’t you?…there is not a realistic alternative to our synthetic money driven existence anymore…am sure I’ve read somewhere that the global population increases by 1 Billion every 12 years now and that’s accelerating. Earth’s systems simply can’t support these numbers, even if we all did our best to live ethically and keep a small pollution footprint etc…we’ve been detached and removed from our food sources and the natural systems which used to sustain us as human beings; this greed-driven, money-orientated process, has created a population that is far outstripping the earth’s ability to support it, and there’s no way back.
Added to that every time populations try to act, sign petitions, complain, try lifestyle changes and push solutions that could give the planet ( and ourselves) some breathing space from the downward spiral, greed prevents progress, and continues to increase the harm.
Another reason people don’t do anything individually is because they feel powerless to affect change in policy makers choices, and know the pointlessness of individual action.
Every citizen on earth now should have a digital vote regarding all planetary decisions affecting the earth’s systems and other global issues ( including bombing climate weakened areas (eg. Through drought) that will displace peoples and cause a refugee crisis for other countries to deal with, since certain acts committed against the earth have global and long term effects, not least effecting neighbouring countries weather, harvest, natural environment, resources, water supply, health etc…including the use of weather manipulation, dams, whether we should limit the number of children to a certain number per woman globally, and where OUR money should be spent ( because it’s not their money that they’re using to commit all the crimes against the planet, it’s ours).
For example, spend money on drones and military equipment? or on creating new forests to stave off desert expansions and droughts? Spend on sending technological aid to China or India to retro fit factories with chemical harvesting/ absorption equipment to reduce/recycle emissions? Or spend on developing new and ever more evil ways to evade agreed-upon emissions levels? Allow corporations to drop billions of tonnes of plastic and other materials from their ships into the world’s oceans and leave it there? Or make all those shipping plastic in any form to contribute to the cleanup? Spend money on spraying toxic chemicals into the atmosphere in an effort to make it rain? Or spend the money on technology that will absorb or reduce methane in the atmosphere?…..it goes on…and on….we need to be able to vote on these issues as human beings living on earth…at the moment the power is with those who lead…we vote them in and they do as they please, often insanely refusing to agree to act in the interests of the planet! Rarely doing what they promise regarding a host of global issues affecting climate, pollution and even their own survival…government decisions are often unhealthy when they feel the people can be easily controlled or diverted…and as humans What we want for the earth and its systems has been ignored for a very long time…as a global population every individual needs a choice on the future of humanity and earth’s remaining species.
statements such as gary’s, above, are tragic.
consider:
from his picture, i see he wears a suit.
a suit, requires dry cleaning. yet our society, gives implied success and power to the image of a suit – while a lowly, undyed, organic, cotton outfit is seen as a cheaper outfit, not successful – even though it would be far superior, in terms of durability, and ecological friendliness.
but nope – we teach our society to RESPECT something nonsensical!
consider what you would wear at your wedding? a suit perhaps, a tuxedo, a wedding gown? a simple, eco-friendly oufit? these archetypes are destroying the environment in the name of respect!
can you not see out of this stupid mind trick?
it’s just another example.
psychosis is very tricky. mass psychosis even worse.
ok, here’s a good one
– i just took an alaskan cruise a few weeks ago (no choice)
the ship, the holland-america “zuiderdam” uses 200,000 gallons of gasoline -PER DAY – to power the turbines – and 97,000 gallons of deisel, PER DAY – to power the ships systems.
total:
for a 7 day cruise,
0.6million gallons of deisel +
1.4 million gallons gasoline.
HAHAHA
(oh, in litres the numbers are just too ridiculous to even bother with)
all burned into the atmosphere, and deposited in and around alaska,
hahaha.
why gee, that’s a lot of gas, don’t ya think – and what for? just to show a bunch of rich people what the unpolluted world looks like. and pollute it in so-doing. holy crap, the irony was more startling than the scenery.
but cruises are a treat, right? they are a form of celebrating success. you might one day be so lucky as to go on a luxurious cruise! i’s a trick. what about the community choice like NOT burning that gas into the air, like NOT going on those absurd floating hotels just for petty LEISURE.
detroy the environment, for LEISURE! sure.
it was hilariously tragic to see everyone on the ship rushing around to glimpse a whale! a glorious whale!! “i saw it!” they would exclaim in delight – and then they immediately return to their salmon dinner. omg.
i did get some great digital photos of the glacier calving though! i think i’ll post them on a “blog”, and use a 500 watt computer just to look at them. makes so much sense. ???
just look at gary’s post. then stare into your own hands.
what choices will you make immediately next?
we must make eco-friendlyness a very enviable trait, a very successful, sought after “way”. the only way the mass of “gary’s” will uptake the solution, is if you feed it to their insecurities. sexy chicks await those who are eco-friendly…..
the question becomes:
how do 100,000 people stop 6 billion uninformed people from detroying everything?
Definitely living up to your call name. The other side to the global warming discussion that i’m not hearing are strategies for a warmed globe. In otherwords when we (sorry for my pessimism) we fail to prevent further warming and we begin to see changes in sea levels, rainfall patterns on a constantly varying pattern, how do we help communities and the global society to adapt?
the standard reaction of the world will be for the unaffected areas to raise money to try and help the affected areas.
2 critical errors in thinking, imho (1 obvious, the other not so..)
1) the costs will escalate too high
2) money cannot solve the problems that money creates
when people give money instead of effort, and you take into account WHERE THAT MONEY IS COMING FROM – then you must of course realize the paradox, or is that catch-22….?
consider:
the “air conditioner repairman” donates $100 to help out the flood victims in the UK…. and is content that this helps, and returns to what he is doing, just a workin’ guy like anyone, ya know?
the solution, brought to you by the cause – heheh.
so, i think people would donate like crazy, what they can afford, then go out and do whatever it takes to RETAIN THEIR CURRENT LIFESTYLE. i.e. —> detergents, oil, plastics, more oil, flights to japan, web-casting camera phones, digital baby pictures
the environment is the silent victim, leveraged for our instinctive desire for individual gain – and ignored by people who INVENTED economic “science” and forgot to include the environment cost in the whole model. ooops. (or is that, haha?)
i need an iphone, right? marketing. move units. make impressions, we need eyeballs.
a solution – not money, but EFFORT – human effort – is what is required. money will have to lose meaning, and compassion and human need and effort will be all we are left with.
water, food, shelter, healthcare, environment, love
truly i believe that we will drop the charade ONLY AFTER IT IS VERY VERY LATE in this game, and it will just dawn on everyone that money’s legitimacy turned to smoke and vanished. we will all be staring at our shoes and feeling pretty shocked i think – because by the time this happens, the environment will most likely have suffered so catastrophically, that the loss to our world will be staggering to any reasonably intelligent person.
and for people among us who are already trying to affect change today – the loss may make us so tragically angry, frustrated, depressed, during the overload cycle – that we will honestly just shut down, internally.
all the bees gone? wtf is that?
it’s a tough puzzle to me, because aid workers *today* simply need money, it’s very real, and it is necessary – I KNOW THAT, I’M NOT OUT TO LUNCH – i’m saying i think it is a trap, that we are not realizing.
coping with the effects of global heating is not going to be for the faint of heart. i think we’re losing a lot already…
goodbye polar bears, forests of BC, cod, birds,
didn’t mean to poison you
we thought it was a good idea at the time
please come back
we’ve got digital cameras!
when you’ve forgotten about when polar bears used to roam the arctic, don’t worry kid, i’ve got tons of pictures of how they lived – all housed in a datacentre in that building over there….it’s called flikr, or something like that…aren’t we lucky!
the de-evolution WILL be televised 😉
– when insect species vanish, due to climate change and toxic water sytems -> lookout. and man i mean lookout.
time is money
since when?
if money is the root of all evil
then what is the root of all good?
love?
get out there and be local – the global will then take care of itself.
do not start a project with an unattainable task, such as “save the planet”.
we can act locally, think globally – stop flying around for the banks, stop taking oil vacations, plant a garden for goodness sake, use biodegradeable soap, forgive your neighbour . get a bike
get fit america!
$15.95/month sponsors a kid in africa! or, gets you hosting w/mobile sync email.
maybe everyone should move to africa where the cost of living is so low…?
maybe gary is right after all. keep your head down, back to work – nothing to see here
Well, the temperatures of Mars, Venus, & the moon are said to be rising & there are no SUV’s or cows farting there as far as we know. So tip your tin foil hat & head back to the drawing board!!
I’m actually going to add the “other planets are heating up” myth to the list above, because it holds even less water than most of the others.
well, that’s great scientific thinking….
“something, somewhere else, is doing something, so let’s draw a completely unfounded conclusion”
good work, you have just proven that mankind is definitely not to blame for anything. we have no need for improvement, everything is FINE.
back to the feast!
Re: about other warming worlds:
Brian, check here for good material on that canard:
http://illconsidered.blogspot.com/2007/04/hot-times-in-solar-system.html
What a very energetic debate, on both fronts. Count me as on the fence.
However one myth I would love to see added is the Recent pacific (?) volcano eruption that dumped more measured CO2 into the atmosphere in one day than humans have in our existence.
I don’t know if it’s true or not, I would just love to see the research.
For my two cents on both sides:
– I thought the “go vegan” idea was comical. Even if possible and we ignore the basic biological fact that we are predators, our global consumption rate would seem to pose an issue, if everyone ate only plants. Correct me if I’m wrong, but don’t most plants consume CO2 and exhaust O2. Consuming more would seem interesting.
– I also think the “not to worry”, or “nothing to worry about” is absurd. Are humans creating or causing global warming that’s going to doom our grandchildren? I don’t know. I honestly don’t think either side has definitive evidence one way or the other. However, are humans generally irresponsible with our treatment of the environment (emissions, garbage, general arrogance)? Absolutely.
We as a species can certainly do better and be more responsible than we are now, that certainly can’t be a bad thing.
However, in my humble opinion, it’s our arrogance that got us here, and our arrogant belief that we can “control” things to “change the environment” will ultimately be a whole other issue.
We should learn to live with, and not try to control everything.
BobCook, the reason being vegan is more environmentally friendly is that WE GROW ANIMALS THAT LIVE ON PLANTS. We grow corn just to feed cows. It takes something like 10 units of plant matter to make 1 unit of meat. That has little do with global warming, because a plant is carbon neutral. It absorbs carbon from CO2 to grow, and that carbon is released when we or the cow consumes the plant and respire. Where do you think the CO2 in our breath comes from? It was the exact same C that the plant absorbed, combined with oxygen we breath in.
The problem with using all these plants to grow cows is that it takes a huge amount of land.
I agree that its for the anti-global-heating lobby to now prove that it is NOT happening since they are in the minority.
Our problem is simply this: “The American way of life is non-negotiable” – George Bush (Jr.), Rio de Janiero, 1992.
Of course it goes without saying we all feel that way to a greater or lesser extent. No-one wants to give up the holiday abroad or the 2nd car or the fridge-freezer.
“That’s it man, game over man”, Hudson, Aliens, 1986
global warming is becoming such a obvious problem that someone somewhere other than Al Gore needs to step up to help drive the bus!
Wow.. this is an extensive article. But I guarantee people will still be denying that they have any impact on the heating of the globe.
I first read about this story on Global grind’s MySpace page at http://www.myspace.com/theglobalgrind. And I was interested so I had to come check this site out.
Hi,
I was looking at DENIAL MYTH #10
Please don’t get me wrong, but you state:
‘Debunking: That this cooling period existed and was global in scope is not disputable’
I must admit to being rather puzzled by this statement! When look at FAQ 9.2, Figure 1. page 703
Click to access AR4WG1_Print_Ch09.pdf
Now to my eyes there are clear differences between the observations: The strongest 1940-1970 cooling in decreasing magnitude are North America, Europe, and Australasia followed by the very similar trio of South America, Asia, and Africa. Which presumably suggests that the aerosols were at relatively low altitude.
Now I have tried so far to identify the source, but admit to have getting lost in the IPCC report and failed so far.
Please help! I’d like to know!
ScaredAmoeba – I’m not clear what you’re asking. If you look at the global graph, you’ll see that the global land and ocean averages both dip in this period.
Could you please clarify your question so I can answer more effectively?
I was trying to track-down the original science that led to the multiple IPCC graphs as referred to in my previous post.
I was hoping that somebody could point me to it.
Actually, I had another look and I think I’ve found it!
DOH!
I must remember not to post when tired!
Glad to hear it. The IPCC working group stuff is very dense and not exactly easy to read through, and figuring out where in the various chapters the science you’re looking for is located isn’t always easy.
One myth I’ve encountered that’s not mentioned is that warming is due to the Earth’s internal heat. This one has variants such as increased volcanic activity under the Arctic Ocean has caused the recent rapid loss of ice. That there is no supporting evidence is apparently irrelevant – just one more case of dismissing all that is known about climate in favour of something for which there is an absence of evidence.
Internal heat? That’s a new one to me. Thanks for pointing it out – I’ll add it to the list of myths to tackle in future updates.
Brian,
While reading through your excellent debunking of the lies spread by the agents of various vested interests, it seemed that you were uncertain about when global warming was discovered. You can find an excellent account in Spencer Weart’s online book ‘The Discovery of Global Warming’. It is linked to from RealClimate via the Start Here page.
This is the link:
http://www.aip.org/history/climate/index.html
Following on from the Nasa Aqua data finding that the Earth is not getting any warmer even though computer models state that it would, how does that tie up with global warming not being debunked?
Do you think the satellite manufacturers might be in the pay of big oil or do you think this may help prove that the whole idea of global warming, and the proof of it happening was based on the misunderstanding of the local urban heat island effect?
Related to this, where will global warming lobbyists get jobs if their gravy train is derailed by the inconvenient truth of Aqua?
1. since 1998, satellite temperature measurements (98% of the globe) shows a slow drop in temperature. this is supported by weather balloons. in contrast, surface measurements show an increase in temperature. however, surface measurements cover only about 15% of the globe with the bulk coming from areas where there is a human population. the 20th century has seen a rapid movement of people from the rural to the city, resulting in the global urbanization of the world. with urbanization comes urban sprawl where most rural environments are lost anywhere near the city. these urban centers directly produce a great deal of heat (up to 4 degrees C greater than rural). it is quite possible that surface temperatures relied on by the ipcc are mainly a reflection of urbanization; .06 degrees is an insufficient value for the large amount of heat produced by large populations. surface temperatures should only be obtained from very rural areas; stay away from cities, towns and any other sources of man made heat.
2. with over 90,000 direct atmospheric measurements, with 3% or better accuracy, of carbon dioxide dating back almost 200 years, why does the ipcc rely on ice core values, a technique that is deeply flawed. obtaining a sample is the result of an intrinsive, brutal technique that shocks the ice with great mechanical and thermal stress. this causes short term melting and permanent cracking, both micro and macro. in addition, the need to use a antifreeze liquid, such as jet or diesel fuel, causes cross contamination. fuel contaminates ice and gases will disolve in fuel; preferrence of methane and carbon dioxide compared to nitrogen and oxygen. the only reason that i can think of, is that the ice core data can be manipulated by leaving out a substantial portion of the data set, or adjusting time scales as one author claimed that the trap gas was 83 years younger than the ice. if ice data were accurate, data should be compared recent ice core data and not direct measurement. this can’t be done because samples taken from the upper levels of the glacier are already substantially low. if upper level data are inaccurate, as suggested by their lack of use, how can one assume that data taken from lower levels are any more accurate. it is a poor scientific method that compares data obtain from one method with data from another without demonstrating eqivalency.
the global warming people better hurry, because we may soon be overtaken by anoverdue return to the iceage. we are in an interglacial period that has already lasted over 10,000 years old (in the last 800,000 years, interglacial periods have averaged 10,00 years). note; most of the northern hemishere is just coming out of a bad winter; china had its coldest and snowiest winter in 100 years. try understanding the Milankovitch cycles.
Peter – On your issue #1, you’re both right and wrong. Here’s the direct quote from IPCC AR4 WG1 FAQ3.1:
That being said, however, AR4 does say specifically that graphs and discussions are based off of surface station data unless stated otherwise. Section 3.4.1.2, figure 3.17, on page 268 shows radiosonde and satellite data from multiple sources, and they all show heating for the surface, lower troposphere, and mid-to-upper troposphere, as the station data does.
And, in case the FAQ3.1 isn’t good enough for you (and I completely understand if it isn’t), here’s a quote from IPCC AR4 WG1 chapter 3, section 3.2.2.2, page 243 where the report discusses the urban heat island effect specifically:
As far as #2 goes, ice core data is used for recent paleoclimate data on CO2 concentration, nothing much earlier than about 1000 years ago, because of the errors inherent in the ice core data. Ultimately, we’re talking about time scales here: +/-83 years of possible freeze-out error in the last 1000 years is 16.6% maximum error – that’s huge. But +/-83 years of error when you’re looking back 600,000 years is 0.02% error – much more reasonable. And given that the accuracy in dating the years itself using radioisotopes is less accurate than +/- 83 years, this error is negligible.
Finally, we’re not “overdue” for an ice age. First off, we have a sample size of precisely 4 recent interglacials, the shortest of which was about 5 thousand years long and the longest of which was about 30 kyr long. The average is more like 14-15 kyr (a precessional cycle, BTW, since you know all about Milankovich cycles), but the standard deviation is about 10,000 years. This means that we cannot estimate when we’re “overdue” to any better than 14,000 years, +/- 10,000. So we could be 8,000 years overdue already, or not due for another glaciation for another 12,000 years. But here’s some interesting statements from the IPCC AR4 WG1 paleoclimate chapter (6):
In other words, the Milankovich cycles were more likely to produce a 30+ kyr long interglacial this time around anyway, even without the addition of a lot of anthropogenic CO2.
Reading a global warming article on newscientist.com, in the comments there’s someone swearing up and down about Henry’s Law. Is is valid in this case or not? It’s application seems awfully simplistic to me, but then I’m not a physicist or climatologist. 🙂
New Scientist link
I’m firmly in the sceptic camp. Not because I want to do drive 4×4’s, not because I don’t think the environment is important and not because I think carbon based fuels will last forever, or that I don’t understand that we need find viable alternatives – – but because when you dig beneath the politics, the name-calling and the rhetoric, the science is just not convincing.
And no, the argument that we should be kind to the envrionment anyway so why worry if AGW is not a real threat, is just not a good enough excuse to hand western governments free reign on dragonian carbon taxation strategies; the Bio-fuel scandal should convince anyone of that…
You might disagree with me, fair enough, but either the world is doomed to AGW disaster (because China and India etc are nt going away) or we are set to follow a course of economic disaster while once again ignoring the real and present human suffering around the third world. Instead of closing down this debate, as so many warmers seem intent on doing (have they no shame?), we should be all open to vigorous discussion and ready to listen to all view points.
I don’t have the time (or space) to go into each point in the post above but I would make this general comment: Why is that as a sceptic myself, I don’t recognise the vast majority of these so-called ‘myths’? They may attempt tp address some key issues in a roundabout way but they are not framed into the kind of arguments I would use against warmers and bear little or no resemblence to my understanding of the sceince. They seem to distort the sceptical viewpoint in order to ridicule and belittle rather than educate. So why is that on warmers sites I see pages and pages of these distorted myth busting posts but very, very little discussion about the real evidence that they say supports their AGW theory?
The IPCC, Al Gore, Jim Hansen, Michael Mann (and all his hockey-stick co-horts), Gavin Schmitt et al… a self-serving circular argument if ever there was one. When anyone reads a ‘myth busting’ post and these are the only sources of reference, keep on digging, the truth is still out there!
It’s interesting that you want a vigorous discussion, but are unwilling to take the time to go into specific points in order to engage in a vigorous discussion yourself.
Calling the myths above “distortions” without providing some evidence thereof is mere namecalling. Similarly, saying that scientific data that disproves a climate disruption myth is “a self-serving circular argument” without presenting a counter argument is no better than “Talk to the hand.”
I’ll happily discuss the overwhelming scientific evidence in support of anthropogenic climate disruption, but only with opponents who are serious about discussing the science. Feel free to come back and comment again when you’re ready to do that.
Brian,
I agree with the points you raise… I certainly cannot claim that my views on the myths as you set them out have any merit beyond personal observation (ie. that they bear no relation to what I as a sceptic currently believe). As you rightly say, any claims on the science or representation of the science need supporting evidence. I’m not a scientist (how many people use that excuse) but I am interested in the science and believe that the stakes involved mean we should all take an active interest in this debate.
Apologies if you think that all I wish to do is name call, I had actually started on second post when I lost it all in a quirky episode with my PC, and as I have a day job didn’t have the time to start again.
I will therefore be back to take you up on your offer, though I fear you may not find my arguments very demanding!
Azz: My issue is that you call yourself a “sceptic” (sic), but you don’t act or talk like one. A real skeptic is one immersed in the processes of science and examining evidence, neither of which you have done so far.
Instead, you’re using the world the way someone might use “Christian” or “evangelical” – that is, in a fundamentalist way that signifies the precise opposite of what the term actually means.
Put another way, so far I don’t see you rejecting anything after examining evidence. I see you rejecting BEFOREHAND on faith.
Really quite different things….
Dr Slammy
As a devout athiest I take umbrance with that comment! 🙂
I haven’t set out my position yet, as Brian quite rightly pulled me up on and I have acknowledged, so you have no basis for that remark.
BTW: Sceptic (English spelling, for that is what I am).
Brian,
Thanks for your offer to discuss the over-whelming evidence with me..
This is a big subject, so I would like to first set out my understanding of the general scientific evidence, if not the detail, offered in support of AGW by the IPCC and others. That way, and if you agree, we can discuss the individual points in more detail within a common framework.
Let me up-front, I’m not a scientist and freely admit to often having difficulty understanding the technical detail contained in many of the climate science papers that underpin the debate (in those cases I rely on external review and/or the summary conclusions that they reach). I will also freely admit to bringing my own prejudices and preconceptions with me to the table, along with a genuine regard for evidence and a willingness to change my mind based upon it.
When I started looking at this topic the first thing that struck me was just how much time is spent in the blogosphere debating the effects (real or imagined) of global temperature rise and how little time seemed to be spent on the key evidential science; as though retreating glaciers, arctic sea-ice or coral bleaching said anything about causality. It was hard to separate out the basic science from the blogs so, I went to the IPCC reports and various official government web-sites (Royal Society, Met Office, NAS, etc) in an attempt to understand the underlying science that supports the AGW position.
I’ve summarised the evidence that I found presented there:
Paleo-climate
* There is a problem, 2nd Half 20th Century climate variation is unique:
– Last 50-yrs temperature increase unprecedented
– Coincides with increased ACO2 concentrations
– CO2 is a major GHG
– CO2 higher today than in last 650,000 years
– Surface temperatures higher today than in the last 1,000 possibly 2,000 years
Global Climate Models (GCMs)
* Identifying the cause:
– Modelling 20th Century climate variations (natural variation + internal and external climate forcing)
– Models suggest CO2 is the likely culprit
– Models predict C02 finger-print (observable)
– Models forecast future climate change scenarios (observable)
Current Observations
* Validation of GCM predictions by observation
– Modern day surface, troposphere and ocean temperature records
– CO2 finger-print
Would you agree in principal with this summary or would you add anything I’ve missed or refute anything I’ve said?
I guess for me this really all hangs on only one element, i.e. Predicting both the future climatic effect and the observable finger-print of the CO2 forcing, because if either the finger-print cannot be shown to exist or if the models fail to accurately predict future climate variation then something else is happening and AGW remains an unproven hypothesis. Discussing the other areas is interesting and helps to add context to the whole debate but ultimately it proves nothing.
Also, just to be clear, what I do not think we need to debate are the things that I hope we both accept, e.g.
* The earth is getting warmer
* Sea levels are rising
* Glaciers are retreating
* AC02 concentrations have risen since pre-industrial ages & this rise is mainly due to the burning of fossil fuels
* AC02 is a GHG
* Anything else that does not pertain directly to the evidence for causality.
I would also like us to agree that just because you or I say that an argument is a myth does not make it so. For example, I’m sure we could and may have a debate on the MWP or LIA (not that again either says anything for causality) but the fact that they are topics listed in your 20 Myth’s doesn’t allow you freedom to dismiss my position on a given point.
If you’re in agreement with the general framework, and as you offered, I’d very much like to hear your over-whelming evidence for CO2 as the driving force of climate change. You may wish to begin with the CO2 footprint evidence…since I would think that this has to be crucial to your argument…but I’ll leave that decision down to you as I don’t want to put words into your mouth.
Azz
Brian,
I’m still waiting for your response to my last comment in the form of a serious discussion on the AGW evidence that you promised me a week ago.
By highlighting the one key area that matters in this whole debate, I have not only made your job easier but I have also shown that I am serious about discussing the science.
The only one remaining question now is this: are you?
I am sorry, Azz, but sometimes real life intrudes into my blogging hobby. I should have an answer ready for you by the end of the week, seeing as some of my other commitments should have settled down by then.
No worries, I know that feeling well… cheers Brian
After I went to all that effort to comply with your request to make my stance clear, the least I hoped for was one piece of evidence that you seemed, in #59, so confident about and so keen to share with me. Hey ho! Won’t be back. Waited long enough. We all have lives to lead…
Azz: I know Brian has replied and doesn’t need me to support him. But I want to make something clear. Nobody here makes a damned penny. In a good month we make enough to cover our hosting and we consider ourselves lucky. So we have jobs – some of us have very, very demanding and time-consuming jobs. We have families. We have other demands of all sorts. How much money did you chip into the Tip Jar, by the way?
Put simply, this is a HOBBY. A time-consuming hobby. You have now gotten more attention from Brian on one thread than most every commenter on every blog in the world has received in his entire goddamned life. I appreciate Brian’s engaging spirit, but I need to make clear that we’re not your monkey. You have something to say, say it, but you are not ENTITLED to a response of ANY sort and I’ll be damned if I have any patience for people who think they have a right to get all pissy when we don’t cater to their fucking schedules.
You want to contribute to the community, do it. You want to go live your life, good on you. But nobody here has missed any of your deadlines.
Azz,
If you get this and yet choose not to return, so be it. But seeing as I just got free enough of some of my real-life commitments to address your original points, I figured that I’d respond. I can certainly understand your frustration at the long time it’s taken me, and I can’t begrudge your choice to move on.
That said, however, if you choose to engage in a discussion after all, that would be great.
You said:
You’re already far ahead of many of your contemporaries who reject the observations and even in some cases the physical scientific basis for carbon dioxide (CO2)being a greenhouse gas. I have no disagreements on these starting points in any way.
The CO2 fingerprint is perhaps the most important “proof” that the GCMs are correct, so as you suggested, I’ll start there.
I’ll admit that the fingerprint has not been observed. However, detailed statistical analyses of the available satellite data (RSS, UMd, UAH) since 1979 and of radiosonde data (HadAT, RATPAC, RICH, and IUK) since about 1959 has revealed that there are significant errors and uncorrected biases in all datasets. Removing these uncorrected errors is a major focus of all satellite and radiosonde data providers at this point. After all, if the data errors are 3-10x larger than the predicted trend that’s being looked for, then you can’t pull the signal out of the noise. So it’s not possible to draw conclusions about the GCM-predicted CO2 fingerprint at this time.
This doesn’t mean that the prediction is wrong, however. We simply don’t know yet. We have what amounts to an absence of evidence, not evidence of absence.
That said, though, we know that the GCMs have to be grossly accurate, even if they’re inaccurate in one or another specific area. They’ve been constructed using physical laws as we understand them and then tuned until they approximate the real climate response over the observed and/or measured past. When the effects of athropogenic CO2 is removed from the GCMs, the model predicts a much colder Earth than what has been observed. In other words, the models are only accurate when ACO2 is included.
Even without a fingerprint, we can fall back on secondary effects and use the Sherlock Holmes method – eliminate the impossible and whatever’s left, however improbable, must be the truth. It’s in this process that the evidence becomes overwhelming.
A huge number of alternative methods have been proposed that explain the observed warming. None of them are sufficient, alone or in combination, to explain the observed warming without the addition of an amplifier (or amplifiers). The only amplifier that has changed appreciably in recent memory is the amount of GHGs in the atmosphere – methane and CO2 from agriculture, CO2 from energy consumption, industrial chemicals, and so on.
We know that the cause isn’t orbital variations known as Milankovic cycles, because we can plot our position in the various cycles and we’re presently on the cold side of a cycle, not the hot side. We know the cause isn’t just the standard solar cycle because it varies far too little to account for the observed warming. There is debate about cosmic rays and cloud formation because cosmic rays do help seed clouds, but there have been at least two studies that found the connection between cosmic rays and cloud formation insufficient to explain the observed warming without also adding ACO2 into the mix.
That’s a good enough starting point for now. If you choose to engage, we can go further, and again, I apologize for my excessive delay.
You’re whole insulting post centres around some idea that I have been demanding that Brian play to the beat of my particular drum. This is just not true. Take a look back at my posts, the written record backs me up.
Let’s review, shall we?
“After I went to all that effort to comply with your request to make my stance clear, the least I hoped for was one piece of evidence that you seemed, in #59, so confident about and so keen to share with me. Hey ho! Won’t be back. Waited long enough. We all have lives to lead…”
And yet … you’re back.
If two and a half responses qualifies for this prestigious honour then someone’s not taking their blogging duties very seriously, or maybe the height of that horse you’re sitting on is giving you altitude sickness, contributing to your impaired judgement.
I’m describing reality, and your response indicates that you’re not terribly familiar with blog comment threads. But hey, prove me wrong. Go to any other major blog and get a principal writer to spend the amount of time on you that Brian has. Then get back to me with the URL.
Brian: Thank you kindly for your recent reply, it would be interesting to take this further but I’ve yet to decide if it’s worth my time debating in a forum where Dr Slammy sets such an unsavoury tone. It does you and this site no favours.
Yes, we’re bloody lucky that you’ve honored us with your presence. Fortunately for you, there’s a time-tested solution for those who have been unjustly affronted: it’s called “voting with your feet.” Feel free to avail yourself of it.
Dr Slammy,
Once again you have taken an aggressive and wholly unwarranted position against me without provocation or justification of any kind. I know this blogging lark is hard work and time consuming but maybe you should take a break and find some time to get down off that high-horse of yours..
You’re whole insulting post centres around some idea that I have been demanding that Brian play to the beat of my particular drum. This is just not true. Take a look back at my posts, the written record backs me up. I made an original comment and was roundly (and speedily) challenged to provide detail. I spent my own valuable time complying with that request (you aren’t the only ones with demanding jobs and families) only to wait over 2 weeks for any kind of response; but only then following what was meant, and I hope taken, as further polite prompting from me.
In my defence to that prompting I would offer only the belief that all good debates need energy, which in turn requires some effort and commitment on both sides to respond in a timely and courteous manner. The only charge you can lay at my door then is that I was eager to continue a dialogue with Brian that he himself had offered. At no time have I ever felt *entitled* to a response from him, let alone expressed that verbally, nor have I been intentionally rude or pissy to anyone on this site – unlike you I might add.
“You have now gotten more attention from Brian on one thread than most every commenter on every blog in the world has received in his entire goddamned life”
If two and a half responses qualifies for this prestigious honour then someone’s not taking their blogging duties very seriously, or maybe the height of that horse you’re sitting on is giving you altitude sickness, contributing to your impaired judgement.
As I said, I was interested to hear Brian’s views and keen to contribute further to this forum but obviously you’re just interested in getting your kicks from insulting people.
Brian: Thank you kindly for your recent reply, it would be interesting to take this further but I’ve yet to decide if it’s worth my time debating in a forum where Dr Slammy sets such an unsavoury tone. It does you and this site no favours.
All the best,
Azz
Dr Slammy, I see that you’re still riding high!
Given that you have at no time ever attempted to add anything constructive to the topic that I had hoped to discuss with Brian, I can only determine that your only interest on life is insulting people and closing down debate. Well congratulations!
But, if we are going to review something, let’s do it honestly. The simple facts are these:
1. Brian offered to debate with me (#59) if I were to substantiate the comment I made originally (#58).
2. You decided to attack me, without provocation (#61), even though I had accepted and agreed with the criticisms made by Brian about my original post (#60).
3. I responded promptly to that offer (#63) and set out my position as requested by Brian.
4. A week later and after no response, there was a polite interchange between myself and Brian where he commented (#65) that life had got in the way and he hoped to respond to me by the end of that week
5. Two further weeks later, and I was giving up any hope. The prompting comment you quote (#67) was meant to be light-hearted (when have you ever used “Hey ho!” in anger?!). The reference to having a life was only mirroring Brian’s own words in comment #65, and was not meant in any derogatory way.
6. Brian was good then enough to respond and I was working on a reply but…
7. You decided to attack me once again.
Final two points, you said:
“I’m describing reality, and your response indicates that you’re not terribly familiar with blog comment threads. But hey, prove me wrong. Go to any other major blog and get a principal writer to spend the amount of time on you that Brian has. Then get back to me with the URL.”
1. Brian chose to comment on my original post and offered to debate. The only other time he spent on me was when he finally came up with the goods – it was after all him that made the claim (#59) that he had the over-whelming evidence and was willing to share it with me.
2. Why don’t you go find the URL that proves you’re not a complete jerk then get back to me with a comment that is on topic.
Apologies Brian, I’m not sure who appointed Dr S. as your official spokesman. If he ever gets over himself I might be able to write a response to your last post.
Azz, You may not have intended your comment #67 to be derogatory, but I still took some small offense and then decided that I’d let it go and instead focus on the science. That is, after all, what we’re here for and what this post and long comment series is really about.
Your issues with Slammy and his with you are your own to work out, or not, as you are so inclined. They don’t involve me except in the most peripheral sense, and I’ve chosen to stay out of the way. My silence to date has been neither approval nor disapproval. Sometimes silence simply means that I’m waiting for something that affects me directly.
I don’t know if you’ve done this or not at this point, but for the future, you might want to click the “notify me if there are responses” button. That way you’ll get an email when someone posts a followup and you won’t have to come back every few days to manually check if any new comments have been posted. If you tire of the emails, then you can disable the email notifications just as easily.
Brian,
I’d like to apologise if any of my previous comments have caused you offence, it was entirely unintentional on my part.
A quick response to your comment #68.
Thank you for confirming my understanding of the AGW case; i.e. that there is no empirical evidence in support of the theory that there is a high level of climate sensitivity to increased C02 concentrations in the atmosphere. The theory itself is supported only by GCMs, which in turn is dependent soley on our growing but still very limited understanding of the science and our ability to model it.
To me, what you have described is the flimsiest of circumstantial evidence, not enough to convict and certainly not over-whelming.
Cheers, Azz
Actually, that’s not what I said, Azz. I said that the tropical troposphere fingerprint hasn’t been detected yet. It’s quite a leap from that statement to “there is no empirical evidence in support of the theory that there is a high level of climate sensitivity to increased C02 concentrations in the atmosphere.” And the theory is not merely supported by GCMs, as you claim.
However, even if that were true, there is a long list of climate predictions that GCMs have made that have been verified. In no particular order, they include:
Stratospheric cooling as a result of more energy absorption in the troposphere.
Sea level rise.
Increasing ocean heat content.
The increased elevation of the tropopause.
The poleward migration of the jet stream.
A measured reduction in the amount of outgoing longwave (IR) radiation.
More dramatically increasing temperature in the Arctic than the global average.
This is hardly an exhaustive list, but each of these things has been measured empirically and was a predicted result of CO2-driven climate disruption by GCMs. This strongly suggests that the GCMs, as imperfect as they are, more-or-less accurately represent the physics of the Earth’s climate.
Now, you’ll probably argue that these predictions could all be accurate in a warming world even if the cause isn’t CO2, and that’s partly accurate. Again I refer you to the fact that the models have been able to reproduce the measured temperature data since the late 1800s. Remove the additional GHGs from human activity and the models no longer accurately reproduce the measured data (I refer you to Myth #13 above for an image that shows this).
It helps that researchers have analyzed the latest versions of climate models (those used for the IPCC) and found their reconstructions are as accurate as reanalyses of the actual measured data itself.
The lack of a “smoking gun” in the tropical troposphere does nothing to negate the overwhelming evidence that third generation GCMs are largely correct, even as they’re being updated and upgraded to better account for clouds, aerosols, black carbon, and so on.
Thanks Brian, my post was fairly condensed but I do still maintain it summarised the position you set out, even though I know that you don’t agree.
I’m not entirely up to speed with all the topics in the non-exhaustive list you have given as further proof of GCM efficacy, so maybe you could point out just one or two of them could *only* be explained by increased ACO2 so we could discuss them further? Cause and effect is highly relevant as you point out and I will come back to.
On GCMs:
I have read your Myth #13 and the paper you pointed me too and I remain totally under-whelmed. Even the paper spends a large amount of it’s time acknowledging the issues it sees with GCMs; the top 3 for me being:
1. Non-independent data set
2. Laboratory science versus real world complexities of the climate system
3. Large areas of uncertainties & assumptions made by models
I do not deny your point that we know much more today about our climate and the basic underlying science than we used to but that misses the point. A model is not evidence in itself, it’s just a set of rules and inputs made by humans with a growing but still limited knowledge of the subject matter. To describe that level of knowledge as high in order to give the impression that we pretty much know it all and therefore we can have high levels of confidence in output of GCMs is either intentionally misleading or a little dishonest.
The bottom line for me then is this… being able to retro-fit a model when you already have the answer is not compelling science and can never be considered empirical evidence. Further, adding general observational evidence of the earth warming and the effects of that warming does not give any more weight to the theory you’re trying to prove.
So when addressing the issue that started this discussion off, i.e. your claims of over-whelming evidence for AGW, I will continue to focus on the 2 points central to most skeptics postion:
1. Cause and effect
2. Empirical evidence
Pointing out number 1 when you make a spurious statement about sea level rise (for example) does not weaken my position it only questions why you raised the point in the first place…
If you had number 2, you wouldn’t be talking to me about GCMs.
Cheers, Azz
While I agree that it’s not evidence, model results can be compelling nonetheless, especially when modeling is the only way to run multiple experiments on a system like the Earth’s climate. We can’t create lots of Earths and run controlled experiments on the real thing, so we have to create those Earth’s in a computer. Ultimately, as I discuss in Myth #19 above, the purpose of predictive models is not to provide independent data, but to generate a reasonable level of certainty about an outcome under the expected operating conditions. Just because you don’t like models in genral doesn’t mean that they’re not supremely useful tools.
The way you prove out a model is by using it to generate a hypothesis or multiple hypotheses that can be tested and verified with measured data. Then you compare the model’s predictions with real data and make adjustments to the model accordingly. The existing GCMs have gone through this iterative process, improving each iteration, at least six times over the last 20 years or so. The “general observational evidence” that you agree shows the Earth is warming up have largely been predicted by the models. This supports the hypothesis that the GCMs are mostly accurate in a statistically rigorous sense (as defined by Monte Carlo analyses of how the multiple models respond to multiple variations to input parameters).
Furthermore, once a model has been proven out, the proven model can be, and usually is, used to determine what is likely to happen if some initial condition or internal variable changes. In electronics, this would be like replacing a resistor with a totally different value or a different component entirely (a capacitor, say), or injecting noise into the design that was previously noiseless. Ultimately, this is done becaus it’s easier and cheaper to run a hundred iterations of model than it is to build a hundred different pieces of hardware. In the case of GCMs, the models are run with ACO2 (or water vapor, or what have you) removed. And the results show – in nearly every case – that the predicted climate response without ACO2 is radically different from reality.
So, let’s examine some of the evidence that the models are correct a little more closely (but in no particular order).
The models predicted that a warming world would push the jetstream toward the poles. This has been detected.
The models predicted that the tropopause would rise gradually in altitude as a result of warming. This has been detected, and the models require ACO2 for the modeled response to even remotely match reality (see Figure 9.14 in the IPCC AR4 WG1 Chapter 9, page 700).
The models predicted that outgoing shortwave radiation would change as a result of aerosols. This has been detected. See Figure 9.3 in the IPCC for the shortwave radiation effects as a result of Pinatubo and how the simulations that included Pinatubo correctly modeled the shortwave radiation effects as a result of aerosols.
The models have predicted an increase in ocean heat content as atmospheric heat is absorbed slowly by the oceans. Ocean heat content has been increasing as expected, and the models again require ACO2 for the modeled response to come close to reality (see Figure 9.15 in the IPCC AR4 WG1 Chapter 9, page 706).
The models have become accurate enough that they’ve been used for regional predictions of atmospheric temperatures, and those predictions have all been shown to need ACO2 in order for the models to match reality (See Figure 9.12, IPCC AR4 WG1 Chapter 9, page 695).
The models predicted that, as ACO2 built up in the troposphere and it warmed up, the stratosphere would cool off. This has been detected, and in all datasets (see Figure 3.17 in the IPCC AR4 WG1 Chapter 3, page 268). This last piece of evidence (that I’m choosing to focus on) cannot be reproduced by solar irradiance changes, since the only way that the stratosphere can cool is if the troposphere is keeping outgoing energy from reaching the stratosphere in the first place. If increased solar irradiance (which varies WAY too little to cause the observed changes anyway, but that’s a different issue) were the cause, then the stratosphere would have to warm, not cool, and that’s not happening. So something is keeping the energy in the troposphere.
At this point, there’s only a couple off things that could keep the energy in the troposphere – GHGs and clouds being the two main ones. The two most important GHGs are water vapor (which has been shown using independent empirical evidence to be a feedback, not a forcing due largely to its short residence time in the atmosphere) and CO2. And clouds are probably the biggest unknown remaining in the models today – sometimes clouds warm the earth, sometimes they cool it, and modeling when each happens and how has proven to be difficult.
Ultimately, though, I think you’re asking for a level of certainty that simply isn’t possible in reality, never mind any field of science. Science deals with probabilities, not certainties, and there’s always a small chance that what’s currently considered to be caused by X is actually caused by Y. That’s fundamental to the scientific method of “hypothesize, measure, compare measurements to hypothesis, update hypothesis, measure again” ad infinitum. There’s not even 100% unequivical proof that gravitation works the way we think it does, or that General Relitivity is correct. If your standard is 100% unequivical proof, then a) you’re not a skeptic, and b) you’re looking for answers in science that it can’t provide – try religion instead.
BTW, in the process of discussing the empirical evidence thus far, you’ve been breaking your own rules (which I agreed to, if you recall) by simply dismissing the evidence I’ve presented thus far. Simply saying that “there is no empirical evidence” or that the evidence presented thus far is “the flimsiest of circumstantial evidence” doesn’t make either so.
Now, Azz, if ACO2 isn’t the cause, then can you hypothesize what is?
Azz-
“Every man takes the limits of his own field of vision for the limits of the world. ” – Arthur Shopenhauer
You consistently state that you have limited, basic or incomplete understanding of the AGW problem, yet are quite defiant to someone (amongst a vast community) with obviously superior knowledge. You have stated you are not a scientist. you have conceded to nearly every AGW theory, yet overly rely on the problem of induction to refrain from conceding the point.
If you were a leading thinker in physical sciences, had a series of published papers and presented compelling, repeatable evidence (as you demand, receive, yet still reject) your arguments might hold water. Do not confuse “doubt” and “cynicism” with “skepticism.” Skepticism is based on empirical rigor, as Brian has asserted and provided, you have not. As well, if you concede that the earth is warming, ACO2 is rising etc. and still can’t get behind the AGW theory, what then, as Brian also queries, is your solution (or cause of the effects). “I don’t know”, “we haven’t found it yet”, “we need to reopen the debate” or “we need 10 years of consistent study” (the mantra of GWB, stated at a time which the IPCC had been in formation for 9 years…) is insufficient and merely returns back to the reliance on the problem of induction or, even less noble, a simple cop-out.
I would love to hear a reply, or, simply a reply to the last post of Brian’s.
Eric
Eric,
Thanks for those kind words. Given the inclusivity of the message held within your opening quotation I will happily hold up a mirror so you can bathe in the reflection of its light and wisdom.
Don’t get carried away with my obvious good nature, I’m not flattering about the rest of your post. Indeed I was worked up enough, for about 2 minutes, to consider a full and comprehensive response to all the fatuous comments you make but to be honest after reading it through again, I realise that you have either not understood my arguments fully or have chosen wilfully to misrepresent me – hence further discourse with you on this topic would I’m sure prove to be an extremely unsatisfying distraction.
I would make one general comment and that is to say that contrary to what you appear to believe, I have a very good understanding of the AGW theory and I have read much on both sides of the debate. I concede only to not being a scientist but that does not make my understanding and grasp of the points that matter in this debate inferior to yours or anyone else’s, nor indeed does it make my position inherently wrong. It is for those that support the idea of AGW to describe the hypothesis in detail and to set out repeatable tests based on falsifiable empirical evidence before the hypothesis can become an accepted theory. It is not my responsibility to do that for them. My position is simply that despite what the NASA scientists and their herd of followers would have us believe, the AGW movement has failed thus far to move beyond the hypothesis stage and that the empirical evidence we do have has failed to provide the required support it needs and may even point in the opposite direction.
The one thing I do agree with you on is that after all the much appreciated effort that Brian went to on his last post, I do owe him a response. Thank you for the prompt I needed to set about doing just that.
Best regards,
Azz
You say:
“Let me up-front, I’m not a scientist and freely admit to often having difficulty understanding the technical detail contained in many of the climate science papers that underpin the debate”
“I will also freely admit to bringing my own prejudices and preconceptions with me to the table, along with a genuine regard for evidence and a willingness to change my mind based upon it.”
“I’m not entirely up to speed with all the topics in the non-exhaustive list you have given”
As well as:
“I would make one general comment and that is to say that contrary to what you appear to believe, I have a very good understanding of the AGW theory and I have read much on both sides of the debate.”
Which is it? Do you maintain that you “have difficulty understanding the technical detail” but “that does not make [your] understanding and grasp of the points that matter in this debate inferior?”
Interesting.
You say:
“It is for those that support the idea of AGW to describe the hypothesis in detail and to set out repeatable tests based on falsifiable empirical evidence before the hypothesis can become an accepted theory. It is not my responsibility to do that for them. My position is simply that despite what the NASA scientists and their herd of followers would have us believe, the AGW movement has failed thus far to move beyond the hypothesis stage and that the empirical evidence we do have has failed to provide the required support it needs and may even point in the opposite direction.”
Brian offers:
“Ultimately, though, I think you’re asking for a level of certainty that simply isn’t possible in reality, never mind any field of science. Science deals with probabilities, not certainties, and there’s always a small chance that what’s currently considered to be caused by X is actually caused by Y. That’s fundamental to the scientific method of “hypothesize, measure, compare measurements to hypothesis, update hypothesis, measure again” ad infinitum. There’s not even 100% unequivocal proof that gravitation works the way we think it does, or that General Relativity is correct. If your standard is 100% unequivocal proof, then a) you’re not a skeptic, and b) you’re looking for answers in science that it can’t provide – try religion instead.”
In empirical study there is ONLY hypothesis testing. We assume the null and based on evidence, accept (fail to reject) or reject (fail to accept) our hypothesis, the semantics demonstrate built in skepticism and the impossibility of proof of theory. Shall we begin debating whether or not the sun will rise tomorrow? Surely that is much more pressing issue…
My issue is not your inherent position, you are free to choose, but the extraordinary amount of effort that Brian has put forth with little more than doubt returned on your behalf. I would like to see Brian’s continued response, but, as you put it “further discourse with you on this topic would I’m sure prove to be an extremely unsatisfying distraction.”
However, in any event, I would be interested in reading your theory as to the meaning behind the amalgamation of data and events thus far presented on the topic.
Eric
Brian,
Many apologies for the long period of self-imposed absence from this discussion and for the resulting dereliction of my duty to respond in a timely fashion to your last, very detailed, reply.
I will try to focus my response on the main point of your argument as I see it. That is, that the argument in favour of the AGW hypothesis is based the confidence levels we can draw from the laboratory science and the output of the 21 or so GCMs.
The reasons why you personally share in this confidence is you say fundamentally because:
1.That we understand correctly the fundamental science involved; not just the laboratory science but how climate operates in the real world.
2.That GCMs are advanced enough to model the real-world climate sufficiently well to produce predictions within a high confidence.
This is further backed in your opinion that the model output can be measured favourably, within those confidence levels, to real world observations; you then kindly go on to list some (but not all you say) of those model predictions.
I hope I have not misrepresented you in anyway, it is not my intention to do so. Naturally I disagree with these points or I too would be with you on the AGW side. But let’s start on a positive; common ground where we do both agree:
“Models are useful tools and whilst not evidence themselves can generate a reasonable level of certainty about an outcome under expected operating conditions.”
Where I think we separate is only on the level of confidence that we have in the understanding of our climate knowledge and our ability to model it. Dr David Evans says it better than I could:
** “Computer Models Incorporate a Lot of Sound Empirical Science
Yes they do. The climate models contain some well-established science that has been verified by empirical observations. But they also contain a myriad of:
• implicit and explicit assumptions
• omissions
• guesses
• gross approximations.
A single mistake in any one of these can invalidate the climate models.
Typical engineering models that mimic reality closely contain no untested assumptions, material omissions, guesses, or gross approximations. They are the result of mature understanding of the reality being modelled, and have been tested ad nauseum in a wide range of circumstances. On the other hand, climate science is in its infancy, individual models routinely fail most tests, the climate models are riddled with untested assumptions and guesses, they approximate the atmosphere with cells a hundred kilometres square and hundreds of meters high, and they do not even attempt to model individual cloud formations or any feature smaller than the cell size. Don’t let the word “model” fool you into thinking climate models are better than they are.” **//
For a much more detailed discussion of a sceptical scientist’s view of the validity of using model output as the basis for policing making in climate science, take a look at Dr Roy Spencer’s explanation of how these models work and why he thinks they are flawed:
http://www.drroyspencer.com/
In order to hold your faith in the AGW hypothesis you must inherently believe that models are, on the balance of probability, more likely to be right than wrong. Given that it is possible for models to be right but for the wrong reasons, it is surely (as Einstein will testify) the one prediction that fails that has far more significance that the 100 that succeed.
Still, with that in mind, let’s look at some of the specific points you make:
“The models predicted that a warming world would push the jetstream toward the poles. This has been detected.”
It would be good to have a reference for this but my immediate question is this: are you suggesting that increased AC02 caused this move in the jetstream or are you suggesting that it was caused by the general warming of the climate, whatever the underlying cause of that warming? We already know that the models assume AC02 is causing the warming, the question is therefore would the models predict this whatever the cause and if so, as I suspect, this has no bearing on the argument for an anthropogenic cause.
“The models predicted that the tropopause would rise gradually in altitude as a result of warming. This has been detected, and the models require ACO2 for the modeled response to even remotely match reality (see Figure 9.14 in the IPCC AR4 WG1 Chapter 9, page 700).”
The IPCC also explain that the predicted increase in the height of the tropopause is they say caused by two factors; ozone induced stratospheric cooling and tropospheric warming due to increased GHGs (i.e. water vapour). That there has been a broad cooling of the stratosphere and warming of the troposphere is not in dispute. How much of the warming is caused by ACO2 is the key debate. Again, your argument for ACO2 as the cause is circular. However, what the models also universally predict is that the same warming in the troposphere, if caused by increased AC02, will create a hotspot above the tropics. This fingerprint has not been observed and, if using the scientific principles you espouse, you should acknowledge this as a significant and major flaw in your theory. I wonder if you will?
“The models predicted that outgoing shortwave radiation would change as a result of aerosols. This has been detected. See Figure 9.3 in the IPCC for the shortwave radiation effects as a result of Pinatubo and how the simulations that included Pinatubo correctly modelled the shortwave radiation effects as a result of aerosols.”
I assume by this you’re again trying to show how well the GCMs model our climate but this is still not relevant to the fundamental issue of the effect of increased levels of AC02 in the climate. However, there a couple of recent discussions on the accuracy of climate model feedbacks on the credibility of model assumptions and on ability of models to accurately model past known climate change on Anthony Watts’ blog that I think are pertinent to this debate and interesting:
Climate Sensitivity and models…
Models can’t account for warming in the past:
“The models have predicted an increase in ocean heat content as atmospheric heat is absorbed slowly by the oceans. Ocean heat content has been increasing as expected, and the models again require ACO2 for the modeled response to come close to reality (see Figure 9.15 in the IPCC AR4 WG1 Chapter 9, page 706).”
I’m not as well read on this subject as I would like but I know that Dr Craig Loehle has recently completed a study of the ocean heat content anomaly data compiled by Willis et al (2008b), his findings show that since the Argo array of profiling floats programme began taking accurate measurements in 2003, that the ocean has been cooling during the period 2003 – 2008.
These findings and other observations are discussed in detail here by William DiPuccio, in a guest blog on Roger Pielke Sr web site:
http://climatesci.org/2009/05/05/have-changes-in-ocean-heat-falsified-the-global-warming-hypothesis-a-guest-weblog-by-william-dipuccio/
“The models have become accurate enough that they’ve been used for regional predictions of atmospheric temperatures, and those predictions have all been shown to need ACO2 in order for the models to match reality (See Figure 9.12, IPCC AR4 WG1 Chapter 9, page 695).”
All this talk about ocean heat content and regional predictions of atmospheric temperatures and yet no mention of mean global surface temperature these days…
http://rankexploits.com/musings/2009/model-mean-trend-rejecting-since-2001-for-a-year/
“The models predicted that, as ACO2 built up in the troposphere and it warmed up, the stratosphere would cool off. This has been detected, and in all datasets (see Figure 3.17 in the IPCC AR4 WG1 Chapter 3, page 268). This last piece of evidence (that I’m choosing to focus on) cannot be reproduced by solar irradiance changes, since the only way that the stratosphere can cool is if the troposphere is keeping outgoing energy from reaching the stratosphere in the first place. If increased solar irradiance (which varies WAY too little to cause the observed changes anyway, but that’s a different issue) were the cause, then the stratosphere would have to warm, not cool, and that’s not happening. So something is keeping the energy in the troposphere.”
Aren’t you just repeating your second point about the expected rise in the height of the upper troposphere and explaining why you think it can’t be solar induced? I refer back to the point I made then, and ask you to please explain why the second bit of that prediction, the hotspot over the tropics, isn’t in fact there?
“At this point, there’s only a couple off things that could keep the energy in the troposphere – GHGs and clouds being the two main ones. The two most important GHGs are water vapor (which has been shown using independent empirical evidence to be a feedback, not a forcing due largely to its short residence time in the atmosphere) and CO2.”
I’m fine with most of that paragraph although I would contend that ACO2 does most of its irradiance absorption in the first 20ppm and then the effects tail off significantly, what is most important is not more ACO2 but the climate sensitivity to it and whether the feedbacks are then positive or negative…
“And clouds are probably the biggest unknown remaining in the models today – sometimes clouds warm the earth, sometimes they cool it, and modelling when each happens and how has proven to be difficult.”
Completely agree and I refer back to Dr Spencer’s excellent discussion explaining the impact of this uncertainty on model predictions and the AGW theory.
“Ultimately, though, I think you’re asking for a level of certainty that simply isn’t possible in reality, never mind any field of science. Science deals with probabilities, not certainties, and there’s always a small chance that what’s currently considered to be caused by X is actually caused by Y. “
I’m not looking for certainties at all. What I am looking for is scientific integrity on both sides and for an open and honest debate. There are many issues at stake here over and above the obvious human consequences involved whichever side is shown to be correct, not least of these it the credibility of the scientific community in the eyes of the public and the resulting damage that it could cause.
“That’s fundamental to the scientific method of “hypothesize, measure, compare measurements to hypothesis, update hypothesis, measure again” ad infinitum. There’s not even 100% unequivical proof that gravitation works the way we think it does, or that General Relitivity is correct. If your standard is 100% unequivical proof, then a) you’re not a skeptic, and b) you’re looking for answers in science that it can’t provide – try religion instead.”
Religion is a funny one! 0% evidence, 100% faith. For me, that’s much closer to where I feel that Hanson and Gore stand on this particular spectrum. I do agree with you on the general point but the problem with the AGW story is that this is not being conducted with the rigour or the integrity that we expect all science to be based on. Let’s talk about Mann, McIntyre and the hockey stick debacle, high-jacking of the IPCC for political gains – just don’t call me a conspiracy theorist!
“BTW, in the process of discussing the empirical evidence thus far, you’ve been breaking your own rules (which I agreed to, if you recall) by simply dismissing the evidence I’ve presented thus far. Simply saying that “there is no empirical evidence” or that the evidence presented thus far is “the flimsiest of circumstantial evidence” doesn’t make either so.”
Not really, I asked you to show me some empirical evidence and you showed me model output and probability statements. You admitted yourself that the models themselves are not evidence, and so far you have shown me nothing over and above that. The burden of evidence is with you on this one.
“Now, Azz, if ACO2 isn’t the cause, then can you hypothesize what is?”
No, and why should I? If I said that I think it’s a small part GHGs and a large part natural variation following the last mini Ice Age, you’d tell me that models show that this is an incorrect analysis, that natural variation alone cannot be the cause. So I’d ask you to explain the Medieval Warm Period or the lack of correlation between the earth’s temperature and CO2 levels going back over the last 650m years, and the circular argument would begin again.
You believe the cause of recent warming to be the increase in man made AC02 emissions, that’s fine, but if you want me to believe your theory too then show me the evidence, don’t show me your lack of an alternative explanation and call it evidence or berate me for not showing you evidence to the contrary.
Going back to your religious analogy, as an atheist, I feel no compulsion to disprove something that is not there.
Cheers,
Azz
Eric
Ok, you caught me being self-deprecating; it’s a common English failing, although maybe not as common as certain others!
The main point I’m trying to make in the comments you highlight is that as with most members of the public who try to take an interest in this subject I do not have access to the papers published in Nature or Science or anywhere else for that matter. It is not my ability to understand the underlying science, concepts or arguments that I call into question with these remarks but merely a recognition on my part that I rely heavily on others to honestly represent the science that these papers contain in the more public-friendly manner that I require to fully comprehend them and their significance. I also feel obliged to acknowledge where I have not read very widely on a particular topic, knowing full well that my position is therefore less solid.
I’m still not sure why you think that my admissions require that I accept others opinions as superior to my own however or indeed where you think I conceded to nearly every AGW theory, I most certainly have not and if you think that is so then you obviously do not understand the theory you are defending.
You then say:
“My issue is not your inherent position, you are free to choose, but the extraordinary amount of effort that Brian has put forth with little more than doubt returned on your behalf.”
I can only respond to facts that are pertinent to the underlying debate. Central to the issue is how do we know that the GCM assumptions of the cllimate sensitivity to increased amounts of atmospheric carbon dioxide is correct?
So I will try to respond to any evidence that Brian offers that is pertinent to his argument of cause and effect but I will not feel compelled to be driven down blind alleys by jetstreams.
Azz
Azz,
Observation and small participation in this conversation has been extremely informative. This topic is exhilarating to me and, believe me, I have found you a rare breed in that you can discuss the science as science from a skeptical viewpoint and this can remain predominantly civil…the blogosphere is not nearly as representative. The point in saying so, is that I have enjoyed this and give you due respect. But, I digress.
“I’m still not sure why you think that my admissions require that I accept others opinions as superior to my own however or indeed where you think I conceded to nearly every AGW theory, I most certainly have not and if you think that is so then you obviously do not understand the theory you are defending.”
In re-reading your posts, I have come across a major fallacy of my own. You said:
“I’ve summarised the evidence that I found presented there:
Paleo-climate
* There is a problem, 2nd Half 20th Century climate variation is unique:
– Last 50-yrs temperature increase unprecedented
– Coincides with increased ACO2 concentrations
– CO2 is a major GHG
– CO2 higher today than in last 650,000 years
– Surface temperatures higher today than in the last 1,000 possibly 2,000 years
Global Climate Models (GCMs)
* Identifying the cause:
– Modelling 20th Century climate variations (natural variation + internal and external climate forcing)
– Models suggest CO2 is the likely culprit
– Models predict C02 finger-print (observable)
– Models forecast future climate change scenarios (observable)
Current Observations
* Validation of GCM predictions by observation
– Modern day surface, troposphere and ocean temperature records
– CO2 finger-print
Would you agree in principal with this summary or would you add anything I’ve missed or refute anything I’ve said?”
The first time I read that, I read that as a concession of your own beliefs and not a recount of the argument as it stands. Therefore, I hope you can see how I could be harping on such points having misinterpreted the function of that passage. My apologies.
Once again, Brian, Azz, great discussion. I have nothing else to contribute.
Eric,
Thank you for both taking the time to read the comments and participate. I appreciate the honesty and integrity of your last post and the incentive you gave me to re-open the debate with Brian. Although I’m not sure he’ll reply given my time-delayed response: who knows, watch this space.
If my initial comments were not as friendly as they should have been, I apologise; it can be impossible sometimes to distinguish between honest mistake and intentional malice.
Of course, you haven’t actually said where you stand on this subject or why, only commented on your perceived view of my position… Don’t feel drawn if you don’t want to, I won’t be offended and I really should spend more time working at my day job.
Thanks again,
Azz
Will you be kind enough to tell me in what jourals your findings have been published?
Thank you
Cesar
Your defense of the CO2 driving T in the ice cores is comically naive. The 800 year lag did not teach the competent anything–we already knew that T was forcing CO2, else Milankovitch Cycles become irrelevant. Do you deny that M Cycles are behind the ice ages? Or that the M Cycle/CO2 correlation is relevant? If you accept the correlation how do you explain it? Obviously T is the link between M Cycles and CO2, or more specifically, ice sheet extension. So M Cycles are behind ice sheets, and the ice sheets determine T and CO2. You seem to be stuck in Al Gore science.
And I bet you don’t know the first think about the LOD evidence. –AGF
Re-read my last myth, AGF, as you’re committing the very fallacy I describe.
And which fallacy is that? Nice T graph, by the way. Where did you get it–no Medieval Warm Period, no Little Ice Age. Do you not believe in the LIA? Couldn’t you find or make a graph that would show it? Or is your website intended to confuse the most gullible and illiterate? I’m afraid there’s not much here to take seriously. Back to WUWT. –AGF
That image was generated by the US Climate Change Science Program (CCSP) that is responsible for collecting scientific information available into Synthesis and Assessment Products (SAPs) that represent the state-of-the-art climate science as of the publication of the SAP. In this case, the latest CCSP SAPs are from 2009, so they are a little out of date. This particular image is from here and here’s the caption:
I probably should update the list at some point, but given that other sites have far more detailed and up-to-date information, I don’t feel the need. However, as a WUWT reader, you might be interested in this piece of scientific analysis: New analysis shows US temperature record is reliable, rejects 2009 claims by Anthony Watts
Enjoy!
In spite of the fact that the US record is based on a majority of poorly located stations, the bias can no doubt be adequately accounted for. So why bother to put them in good locations anyway, or to inform the station sponsors that their stations are being used for data collection. But to your graph: it seems to have little connection to the caption–one graph, one color; the caption describes two colors, and it seems, two graphs. And as I say, historically known anomalies don’t show up. How reliable is it?
One anecdote is worth a thousand proxies. Rivers froze over, millions starved, salt seas froze, and it doesn’t show up on your graph! Not just the North Atlantic, but in New Zealand and the Andes, glaciers advanced, but it doesn’t show up on your monochrome graph! And this is your evidence?
And again, which fallacy? And did you know that Capt. Cook discovered Arctic pack ice in 1778 that was 100 feet thick? So that lots of well qualified climatologists believe we are still coming out of the Little Ice Age, which doesn’t show up on your graph, and which you dismiss as based on “anecdotal evidence.” Your graph and its caption and the argument it attempts to make don’t seem to amount to much of anything very scientific. You are parroting poorly thought out nonsense. –AGF
You know, I tend to give people the benefit of the doubt that they’re not trolls until proven otherwise. But “One anecdote is worth a thousand proxies” is the kind of statement that shows you’re either a troll or you’re fantastically ignorant of the scientific method. In case it’s the latter (a very small possibility), I’ll simply point out that proxies qualify as data, and science is based upon data, not anecdotes. Similarly, a river freezing over once, maybe even 5 times in a row, is weather, while a river freezing over every year for hundreds or thousands of years is climate.
And if you’d actually read the last myth above, you’d see that I named and described the fallacy. Since you clearly haven’t read the myth you’re supposedly criticizing, attempting to debate you is pretty much pointless since you’re almost certainly a troll.
AGF – S&R has a strict no-troll policy. We also have clear rules against insulting and abusive language. You’re lucky you haven’t been shown the door already.
Brian, feel free to deal with him as you see fit.
So your definition of the scientific method is to ignore historical evidence? A few cold winters in a row? I’m clearly arguing with an idiot. Do you think 100 foot pack ice is minor weather event? Or that the fact that they used to make wine in England during the Medieval Warm Period is to be dismisses as anecdotal weather? Only now has British viticulture made any inroads: it amounts to a tenth of a percent of French production.
And you missed my point entirely on the cores: there is no evidence on a multidecadal scale for CO2 forcing T, or on any scale. On a long term scale we have clear evidence for Milankovitch cycles forcing CO2, by way of ice sheet extension, which clearly entails a rise in temperature. The fact that the Pleistocene doesn’t duplicate current levels of CO2 hardly helps your argument: even ignoring the amber evidience, other more ancient proxies indicate periods of much higher CO2 than at present, accompanied by unaffected temperatures, even ice ages.
You use a graph of a proxy you can’t identify, and when I call your bluff you go off on a tantrum about my not accepting your incompetent approach to the scientific method. It’s a thousand people like you that made David Evans see the light. –AGF
On the Pleisocene: see Myth #6 above and CO2 was higher in the past and CO2 was higher in the late Ordovecian
On the CO2 lags temperature: See Myth 21 above (again) as well as CO2 lags temperature and Global warming is a natural cycle and global warming causes CO2 to rise
On England wine: see the related Greenland was green
On the Little Ice Age: See Myths 6-9 above and coming out of the little ice age
And most importantly, read the scientific papers referenced therein.
As for David Evans, see David Evans’ climate facts hardly factual and, more recently, David Evans’ Understanding of the Climate Goes Cold.
So Samuel, he can call me a troll but I can’t call him an idiot? I see suppression ahead, applied very selectively.
Now Brian, you are denying the relevance of the LIA and MWP, and that is blind refusal to face up to the facts. Greenland was colonized by the Vikings during the MWP and the colony was abandoned at the outset of the LIA–one of many consequences of severe climate change. Monks made lots of wine in England duriing the MWP–profitably. That ended with the LIA, never to be resumed–profitably. How long do you think it took Capt. Cook’s ice to form? Ice is a good insulator, and the thicker it grows, the more slowly it grows. It takes centuries to grow 100 feet thick, and it takes decades to melt such thick ice–the better part of the 19th century. Once that ice was gone things could heat up even more–the permafrost began to melt.
The melting of grounded polar ice causes the earth to slow down, but when the melting is over, Glacial Isostatic Adjustment causes LOD to decrease, and since the advent of the atomic clock–in the 50’s–we have been in a period of slightly decreasing LOD–enough to more than offset the effect of tidal friction. This most likely is due the fact that we have come to the end of the LIA–melting has decreased substantially. Just one more piece of evidence that there is precious little competence behing the AGW scare, and none behing CAGW. It’s for the most part junk science. –AGF
AGF, you’ve shown no interest in reading or understanding the science to date. You’ve presented anecdotes instead of data in contravention of the accepted practices of the scientific method, and in response to being called on that bluff, you’ve simply repeated your statements instead of providing data and support for your claims. It’s abundantly clear that you’ve failed to read the links I’ve recommended. This is the behavior of someone trolling for attention instead of someone interested in holding a legitimate discussion or discussing the state of the science. And S&R says the following in the comment policy:
So, if you’re not trolling for attention and don’t wish to be referred to as a “troll” as a result, then provide data and references for the Cook ice thickness you describe. Point me to mathematical examinations of the LOD problems that you think debunk sea level rise and the human causes of climate disruption. Show me you’ve read the links I referred you to and, more importantly, that you’ve understood the mathematics and science underlying the explanations.
Regional warming is just that – regional. The proxies you denigrate show a unified world where the LIA and MWP were largely limited to the area surrounding the North Atlantic. See this Science article, for example, as well as many of the links I pointed you to earlier.
Don’t want to be treated like a troll? Prove to me you aren’t one by doing the work necessary to understand actual climate science. Continue behaving like a troll and you’ll be in violation of S&R’s comment policy and you’ll be banned. I’ll be here, waiting for you to decide.
“Idiot” is a subjective pejorative. “Troll” is a word that describes some explicitly defined objective behaviors.
Brian, I suggest you check out MWP and LIA in Wikepedia, where you will see several T graphs which do indeed show the rise and fall of the two, apparently based on proxies much better than the one you use. It’s an utter waste of time to argue with someone who insists on the superiority of an inferior proxy over solid historical evidence. My guess is you’ve never heard of Cook’s ice before, and it’s clear you don’t want to know anything about it, or about LOD. You treat the subject like a Bible school teacher who never heard of Wellhausen. And anyone who doesn’t kowtow to what you have written is dismissed with a failing grade. If critical thinking is what constitutes a troll, I’ll take the title. You’ve shown no such skills. Steeped in dogma and ideology, insisting your view is infallible, you are the quintessence of alarmist climate science. Your graph doesn’t even correspond to your caption. That pretty much sums it up. –AGF
Let’s fix your reading comprehension problem, AGF:
Top graph, labeled “Temperature Change,” is captioned “reconstruction of annual-average Northern Hemisphere surface air temperatures derived from historical records, tree rings, and corals (blue), and air temperatures directly measured (purple). CO2 Concentrations” Oh, and look – there’s a blue section that’s derived from historical records, tree rings, and corals, and a purple section that directly measured air temperatures. Yep, you’re right, that does sum it up.
Middle graph, labeled “CO2 Concentrations,” is captioned “record of global CO2 concentration for the last 1000 years, derived from measurements of CO2 concentration in air bubbles in the layered ice cores drilled in Antarctica (blue line) and from atmospheric measurements since 1957.” And look, there’s a blue line section from the ice cores and a purple line section from atmospheric measurement (click on the image to see the blown up version where the color differences are clearer). Yep, you’re right, that does sum it up.
Bottom graph, labeled “Carbon Emissions,” is captioned “reconstruction of past emissions of CO2 as a result of land clearing and fossil fuel combustion since about 1750 (in billions of metric tons of carbon per year).” And look, the blue section is labeled “Fossil Fuels” in the image and the purple section is labeled “land use change” in the image. Yep, you’re right, that does sum it up.
Last chance, AGF. Point me to scholarly work that supports the many unsubstantiated claims you’ve made and prove you’re not a troll. Put up or shut up.
I took another look at your graph, with my laptop this time, and there were the two colors, plain as could be. The other monitor I was using is on its last legs, and the colors weren’t distinguishable, so I owe you an apology on that score. This could have been prevented by using more contrasting colors, but that’s the least of our problems.
How does one go about combining proxies to recunstruct global or regional climate? How do we avoid regional bias? Surely you don’t just average out all the available data. The point being, the process is hardly objective; it is highly subjective.
Next, how reliable are the proxies? In the first place they must be calibrated by a very short historical record. Again, the least of our problems. How do we assign values to the many factors that go into tree ring growth? Still a minor problem. The biggest problem? How do we correlate temperature and ring width? Do you have any idea what the function is between T and ring growth? It is parabolic, with maximum growth at some species specific temperature. When it’s too cold it cold it quits growing and when it’s too warm it quits growing.
What that means is that there is no absolute correlation, but we have to guess from assumed patterns whether T is rising or falling according to altered ring width. And from such guesses a graph is produced, and by somewhat arbitrarily combining such proxies a regional or hemispherical climate history is reconstructed.
Then we have to consider problems like Yamal, where T is flat not only during the MWP and LIA, but in the 20th century. There is a slightly cooling trend evident in the last two millennia.
So when you say I should submit to your hard science and ignore hard history, I’m not very impressed. Rather I’m inclined to refer you to some thorough studies in climate history, that teach us how Australian navigators sailed over southern latitudes a century ago that had been charted as land two centuries ago when they were still frozen over. And how the British marveled at new North Atlantic passages opening up in the early nineteenth century.
Ice extent doesn’t tell us much about absolute T, but it sure tells us a lot about about warming. And the northern extent of a forest (like Yamal, which dropped southward in the last few centuries) tells us a whole lot more than the tree rings preserved in the forest.
And BTW, there ain’t no hockey stick at Yamal. –AGF
AGF, it seems like you’re essentially suggesting that all the questions you’re asking make proxy records useless. This is not the case. I recommend that you start with Section 6.6 of the IPCC AR4 WG1 and read the various referenced papers there to learn just how carefully your questioned are treated. There’s a reason that, for example, dendroclimatology is a separate discipline – it takes a massive amount of care to find trees that have growth rings that are temperature limited instead of water or nutrient limited. These trees tend to be along the Arctic Circle and close to the tree line in altitude because those areas generally have temperature-limited tree growth.
What’s even more important, however, is that there are so many different climate proxies that we can remove all of the tree rings and still not impact the overall conclusions. Several papers have done this very thing, but the most recent (and it’s been out since 2008) is Mann et al 2008. I know that some people (JeffID, for one) claim that this paper’s methodology has been demolished, but I’m still waiting for proof of that in the peer reviewed literature. After reviewing Jeff’s own methodology and code, I asked him to reassess his conclusions given that he made a significant error. To the best of my knowledge, he’s never done so. See here.
The problem with anecdotes, AGF, is that they’re local and poorly documented. Having one ship say “Hey, we made it around the northern edge of Ellesmere Island on X date” (to use a fictional example) isn’t enough – to take that claim seriously, a scientist has to have proof. The claim alone, even documented in a logbook, proves only that the captain thinks he did what he wrote. It says nothing about the ocean currents or local weather conditions that might have opened up the passage for a total of a week, and the captain just got lucky. It says nothing about whether the captain was right about where he was, either.
What we do know is that there are rocks being exposed by ice caps that didn’t see the light of day even during the MWP (see this paper). The jist of the paper’s results is this: scientists know how the carbon isotope C14 is created by cosmic rays, absorbed by lichens and mosses, and decays over time. Lichens and mosses are dormant when covered by ice caps and so absorb no C14. So by measuring the C14, C13, and C12 ratios, scientists can determine when the rocks were last uncovered by ice. When the scientists did this, the found that rocks they tested on the edge of a shrinking Baffin Island ice cap had last been uncovered ~1600 year before. This means that, while the MWP did melt a lot of the Baffin Island ice, it didn’t melt the ice as much as has occurred recently. While this is local data, when combined with everything else, it is consistent with human-caused climate disruption driven by human CO2 emissions.
Ultimately, though, that’s the point – there is so much physics, so much data that supports the theory that it would require dozens of independent datasets to all be wrong for human-caused climate disruption to be wrong. If the climate was your car and it had a brake problem, the mechanic would have to explain away all the symptoms of a brake problem before he could rationally convince you that the problem is your clutch.
Science uses data to determine how the world works. Arguing using anecdotes instead of data is OK in some arguments, so long as you don’t try to say that you’re being scientific in the process. But the human-caused nature of climate disruption is fundamentally a scientific question, so anecdotes don’t belong in the discussion.
Now for a fair representation of how climate “science” typically works, see:
Regards, –AGF
i was kept in the loop over this exchange and had no intent to comment, save for AGF’s last bit. its been great to read you both – and to that extent two people who clearly know a thing more about climate than “more snow mean there aint no climate changin.” im glad to see the conversation reset its tone to cordial.
I would never go so far as to say that proxies are worthless. All over the map, yes, but worthless, no. Craig Loehle did a study in 2007 which excluded tree rings, and interestingly, shows strong anomalies for the LIA and MWP. So Mann et al quickly followed that up with another study which showed that with or without tree rings, the anomalies are dwarfed by the recent T rise. And this is the pattern: independent studies show the historically verified anomalies; CRU staffed studies do not.
For an introduction to the end of the LIA as reported historically see http://noconsensus.wordpress.com/2009/06/16/historic-variation-in-arctic-ice-tony-b/
But we could go back much further. Pliny noted during the Common Era that Egypt had an average of three thunderstorms per summer. About two centuries before that travel across North Africa by horseback came to a halt, and camels were used from then on. Leptis Magna, in Tripolitania, now Libya, provided most of the wheat for the Roman dole. The same city produced a Roman Emperor, Septimius Severus. The city was covered by sand dunes on and off for centuries, till modern excavations. Two notable post-Hellenistic ancients believed the earth was flat. Both were African. And in fact, if you were to tally a census of notable Greek thinkers you would find that more came from Africa and the Middle East than from Europe or Anatolia, and there’s a simple reason for this: the population of North Africa at the time was greater than the population of Europe. In fact we can quite easily blame ongoing desiccation for the downfall of Islamic civilization and the rise of Christianity–the population of North Africa dwindled to nearly nothing, cutting off the Maghrib from Baghdad, leaving great cities like Timbuctu as minor outposts, and leaving cities like Sabratha empty.
Of course all this only continued the earlier climate change which turned the Saharan savanna into desert. Rock art across the Sahara abounds with vanished game. The artists vanished with it. And the Pleistocene river systems were buried in sand. But we’re more interested in the more recent events. Capt. Cook was a brilliant observer with a mission to find a northern passage back to England. He went through the Bering Strait in 1778 and sailed along the coasts of Siberia and Alask as far as he could, but found pack ice “ten to twelve feet high” wherever he went. This translated of course into ice 90-100 feet thick.
You can deny the veracity or relevance of this all you want, but you are taking the word of a very few folk at East Anglia and elsewhere over that of a lot of frustrated climatologists who can’t get there papers published, and a lot of frustrated monks who drowned their sorrows in home made wine, in England, centuries ago. It doesn’t do to call this bit of historical viticulture “anecdote.” Even now British viticulture is less than a shadow of its medieval self, and I ask you to ask yourself, is such a certain piece of history compatible with Mann’s reconstruction or Loehle’s? How many degrees of warming did it take for English wineries to flourish, or do you deny that they did? We really need to get past those two questions for this discussion to proceed any further.
Regards, –AGF
I’m not arguing that Northern Africa wasn’t once much more habitable than it is now. The same is true of the Fertile Crescent (which was, at one point, actually fertile), the Indus Valley, and everywhere else where ancient civilizations once rose and then collapsed as a result of local climate changes, poor soil management, overpopulation, or what have you. Similarly, there’s no question that wine was once made in England. But the question isn’t whether those things happened, but what do they tell us about the global climate? And the answer that you keep ignoring is this: they tell us very little.
The entire Mediterranean drainage basin is 8.5 million square km. That seems like a lot until you realize that the entire surface of the Earth is 510 million square km, so the drainage basin for the Mediterranean is about 1.7% of the surface of the planet. Europe seems like a large area until you run the numbers and find that it’s only 2.0% of the Earth’s surface. The North Atlantic is believe to have been warmer during the MWP, but global climate reconstructions show that the rest of the world was likely cooler during the same period, meaning that the MWP was a regional climate change rather than a global one. The following image is from one of those reconstructions
Note how much of the Southern Hemisphere was cooler, how much of central Asia was cooler, but how the area around the North Atlantic was warmer.
What you’re suggesting is that we ignore globally-derived data and analyses in favor of regional anecdotal evidence that, at best, indicates that the climate has changed in the past, but not how or why the climate changed. Only science can tell us how and why, and you’re flat out saying that neither matters in this discussion. You have rejected the scientific method in favor of belief that what happened in a tiny percentage of the world (Europe)represents what was happening in the entire rest of the world at the time.
Again, I recommend you read the many links to climate papers I’ve pointed you to, such as the IPCC, the Baffin Island paper, and the paper on the regional nature of the MWP. Don’t take my word for it – but don’t take McIntyre’s, or Watts’, or ID’s, or Montford’s, or Loehle’s either. Read the actual published papers yourself and form an informed opinion based on them. That’s what I’ve done, and the science is incontrovertible.
Brian, you refuse to address the last two questions, accuse me of rejecting science, and ignore much of what the IPCC report itself admits:
“There are far from sufficient data to make any meaningful estimates of global medieval warmth (Figure 6.11). There are very few long records with high temporal resolution data from the oceans, the tropics or the SH.
“The evidence currently available indicates that NH mean temperatures during medieval times (950–1100) were indeed warm in a 2-kyr context and even warmer in relation to the less sparse but still limited evidence of widespread average cool conditions in the 17th century (Osborn and Briffa, 2006). However, the evidence is not sufficient to support a conclusion that hemispheric mean temperatures were as warm, or the extent of warm regions as expansive, as those in the 20th century as a whole, during any period in medieval times (Jones et al., 2001; Bradley et al., 2003a,b; Osborn and Briffa, 2006).” (IPCC 2007:
http://www.ipcc.ch/publications_and_data/ar4/wg1/en/ch6s6-6.html )
You admit desiccation and population loss in the Sahara and Mesopotamia–do you believe this involved any temperature rise? The reason I ask is that there is no proxy data available from the Sahara or Arabian desert–the map you provide is modeled entirely as far as those regions are concerned. See the maps at the IPCC reference above. I accept the argument from Baffin Island: if the conclusions are correct it would indicate at least regional T higher than that of the MWP, but you have already argued for the limitations of such regional variation, and I add to that the caviat of the IPCC itself, quoted above. And since you refuse to address MWP English viticulture, could you at least find a regional British proxy that shows regional heating?
As for the lack of proxies in the Sahara, Arabian Desert, Australia, Atacama, and so on, be advised that the hottest T recorded in the world was in the Libyan Desert half a century ago, and as far as I know it hasn’t been broken. And where more do we expect GW than the Libyan Desert? So the way I see it, you have only shown one instance of current T higher than MWP, one regional proxy, against plenty of anecdote and solid historical evidence. I’ll admit the possibility of a hockey stick that beats MWP; but the probability? Not yet. And we’re addressing a small part of the “science” –haven’t touched sea level rise yet, and that entails the larger farce.
The “science is incontrovertible”? Not even the IPCC agrees with you. –AGF
First, I did address your two questions. I said that grapes in Britain were compatible with BOTH reconstructions. I also said that I accept that grapes were grown in Britain during the MWP. I don’t personally know what the temperature would have to be, but again, I also said that it didn’t matter.
Second, you’re correct that I made an error with respect to the IPCC. I misunderstood the NH data for the global data.
Third, the second IPCC quote does support my contention that the MWP was regional in the NH:
Fourth, I don’t believe we know all the reasons why populations grow, move, and shrink specifically because we lack temperature proxies for, for example, the desert. Changes in precipitation could be the cause as much as changes in temperature. As an hypothetical example, a change in weather patterns due to ocean circulation could result in a multi-decade long drought that overwhelms the culture’s ability to adapt, cause starvation and war, and so on. This is one of the projected outcomes of human-caused climate disruption, in fact, because similar events have been widely recorded in historical and archaeological records.
Fifth, we expect more warming in MANY places than we expect out in the Libyan desert. Look at IPCC Figure 10.8 for example, where the greatest changes are expected in the NH polar regions. Anthropogenic CO2 emissions are running above the A1B scenario (middle row), BTW. Also look at the regional projections (which do have greater uncertainty) and you’ll see that seasonally and annually, the Libyan desert and the Sahara region of Africa are going to get hotter, but the increase in temperature there will be dwarfed by the temperature increases around the Arctic Ocean. Going from 130 to 132 °F won’t have anywhere near the impact of going from, say, 28 to 30 °F (just as an example).
Sixth, look closely at Figure 6.10c, the third breakdown of the image. It shows the overlap of all the different proxy reconstruction uncertainty bands (5-95%) as different shades of tan and brown, with darker meaning that more reconstructions have that zone within their uncertainty band. In other words, the darker brown the image, the more likely it is that the real temperatures were within that range. 6.10c shows that only one reconstruction has an MWP temp that exceeds modern temperatures, a second comes close, but that the region of greatest likelihood (darkest brown) is around a negative temp anomaly of about -.25 °C. And Figure 6.10b shows the mean values for all those different proxy reconstructions, the warmest of which has a MWP temp anomaly of about +0.1 °C. Compared to the modern temperature anomaly of 0.6 °C. So much for “one instance of temp higher than MWP.”
There’s no question that more data is needed, especially in lower latitudes and in the southern hemisphere. But thus far, the evidence strongly suggests that you and the many others like you are simply wrong on the MWP.
can’t seem to post today
I used to be able to post here! –AGF
OK, models suggest greater feedback in the arctic than in the Sahara, so would we expect such at Baffin Island? Considering that more bare rock has been exposed than at any time during the MWP? Here’s the T record for the last 70 years:
[URL deleted to enable posting(?) –T graph for Baffin Island post]
It seems I conceded your point prematurely: no T rise, no GW, no amplification, even with presumably unprecented melting. Unprecedented within the last 2000 years that is–it was about 5 degrees warmer during the LIG, which warming clearly did not cause the Greenland ice sheet to reach a tipping point.
James Hansen would have the Dutch worry much about sea level rise, but they don’t. They know better. It’s clear North Africa dried up, which desiccation decimated the population, but it’s not certain this was due to T rise. In this age of reported T rise rain has increased in the Sahara, and vegetation is returning to much of it, according to National Geographic anyway (July 31, 2009). And true, models predict greater T rise (if not greater max T) at the poles than at the tropics, and supposedly this is happening, even if not at Baffin Island, where (again) unprecedented melting is supposedly occuring without T rise or amplification. But such is the science. The more I study the more skeptical I become.
Camels evolved in the desert or on its fringes–deserts have been around since K/T. But they come and go, and whole ecosystems with them–sometimes within a few centuries or millennia. Vandals and Moors didn’t wipe out the coastal Berbers–the sand did. If GW can green up the desert, more power to it.
But to the point: are Baffin midges more telling than Viking fleas? Not much, it seems. –AGF
Apologies about the posting problem. No idea what was happening, since it doesn’t look like your response was even in the spam trap. As I’m the tech support guy, the fact that it just vanished has me concerned.
There’s a small problem with your claim – you’re talking about a different paper than I am. You’re talking about this paper on lake sediments, whereas I’m talking about this paper on moss and lichen Let’s be sure not to confuse the two.
BTW, if you look at the latest Clyde data, it shows a bit more recent warming than the data that Watts put up, although it might not have when Watts posted the older station data.
Let me ask you a couple of questions, AGF – if humanity isn’t the cause of the warming, what is? Where is the CO2 coming from?
Whoa, I never said we didn’t cause the CO2 to climb. True, the natural exchange is quite a bit greater than human input, but the rise is mainly anthropogenic; secondarily perhaps due to warming, whatever its causes. The questions are, what effect does CO2 have on climate, and to what extent is currently measured warming due to natural forcing. Other problems are relevance of land versus sea warming, how much is the deep sea warming, etc. This science is still taking its baby steps, yet it drives public policy in phenomenal and destructive ways, while serious and addressable environmental problems go begging.
I’ll grant the possibility that CO2 is heating things but I have no idea how much, and I also accept the possibility that it cools the atmosphere at all levels–not just the ionosphere–in combination with the rain cycle. What I don’t accept is anything but the most remote possibility that we are doomed by burning fossil fuels. CO2 is way down on my list of environmental concerns. All the problems of a growing population, logging, farming, habitat destruction in general, exotic species introduction, every step humans make causes disaster for some species or another. Humans are the most adaptable of all species. Polar bears are probablly the safest of all the big carnivores–it’s the tigers that are in trouble; and pandas and tasmanian devils, and thousands of ocean species that are now competing with the bilge water of the seven seas.
Ultimately I believe people are the most important, but if I had to worry about beach zoning, I would worry in this order: 1) tsunamis; 2) hurricanes and ground subsidence; 3) low pressure systems and rogue waves; 4) sewage and ship leaks; 5) sea level rise. The Japanese tsunami measured 10 meters; century sea level rise is between 15 and 20cm, with 7cm projected from AGW. Current annual rise is 3mm. That’s one ten thousandth of the big wave.
So the more important question is not whether, but how significant? –AGF